The folks at Saskatchewan’s ministry of agriculture have produced a digital dashboard that has a complete record of wheat yields for each rural municipality all the way back to 1938. It is an Excel file, 20.5 MB in size, which means a lot of numbers. It’s very easy to select any RM in the province by number and the years 1938 to 2022. Even this old fossil can quickly produce a graph that shows the data for any RM.
Thanks to SKSIS, produced by the University of Saskatchewan’s current dean of agriculture Angela Bedard-Haughn, it is also possible to cut out the soil map for that same RM and place it beside the wheat yield graphs to help sort out the “nature or nurture” part of the equation.
Read Also
India likely to triple lentil import duty
Analysts anticipate India hiking duties to 30 per cent after March 31 to bolster domestic prices on expectation of strong harvest.
To date, I have assembled the data for 17 RMs. In this piece I will pick out a low yielder, a high yielder, and a middle ground. In future articles, scattered in time, I will add more examples. If any reader wants to access the complete data, this is the link. That will take you to a site that actually shows you an example graph, but it is not in detail. To get the graphs you see in this piece, you’ll need to use an Excel file to make one.
First things first: some notes about special years
The graphs are drawn with a ‘dot’ for each year and scaled, so it is easy to read the yield for any given RM for any year of interest. There are some special years of note I will now let you know about — many of which I lived, based on my advanced age.
1939 was before my time but I know that was a very good year over much of the province. Despite the Dirty ’30s seeing many years with poor yields, the 1939 crop was the beginning of the turnaround.
1942 was the mortgage lifter for many farms still struggling from the huge debts of the Dirty ’30s. My dad showed me the cheque that cleared the mortgage on Brunswick Farm at Milden — and, he added, “there will never be another mortgage on this farm.” I respected that decision but it was part of the reason I went off to U of S after two years on the farm.
1954 was the wheat rust year. It was widespread over the province and took down Thatcher wheat, which was susceptible to that year’s race of the disease. My dad was not up to date, so he had seeded the old Renown wheat, which was resistant, and we had a crop. I was 14 at the time — old enough to remember.
1961 was a widespread and devastating drought over much of the province. Most folks who are long enough in the tooth will remember 1961.
1966 and 1976 were both good years over much of Saskatchewan.
1985 was a very dry year south of Swift Current but much better in the rest of the province. We spent much of July at Ponteix and area, drilling for soil salinity. Wheat yields were only about five bushels per acre in that area that year. Stripper headers and the like were needed to gather in the poor crop.
1988 was the big drought, with crop failures over most of the province. As the young folk talk about our current drought cycle, I remind them “we have yet to have a repeat of 1988.”
That brings us to the modern era, with a drought at the turn of the century, especially in 2001 and 2002.
2010 provided 20 inches of rain (April to October) and 2010 to 2017 were irrigation years without the pivot in many areas. The past five years have left a lot of bin room on a lot of farms. The cycle will turn; we just do not know when. Perhaps 2024.
Examples of wheat yield by RM
Shown above are examples for three RMs. The ‘Y’ axis is up to 70 bu./ac. on most graphs, to allow comparison between RMs. There are a couple of RMs that needed 80 bu./ac. to capture the best years.
The RM of Reno, whose yields are shown in Figure 1, is in the extreme southwest corner of Saskatchewan. Much of it is in pastureland so this may not make for a really fair comparison, but such are the facts.


Soils in Reno are mostly solonetzic and Brown chernozemic soils, with limited rainfall and soil structure as yield-limiting conditions. The “nature” factors keep yields on the low side.
The RM of St. Peter (Figure 2), at Annaheim, northeast of Humboldt, has some of the best Black and Thick Black soils. Crop yields can be affected positively by water tables high enough for plant roots to reach. It was my pleasure to run a combine in that RM many years in the ’90s and early 2000s. Canola yields of 70 bu./ac. were a thrill and some areas with wheat near 100 were logged on the combine yield monitor.


It’s interesting to note the sharp rise in wheat yields at the turn of the century. Given recent advances in agronomy, that may be an indication of “nurture.” The sharp rise in yields since 2002 has been experienced at several sites I have graphed.
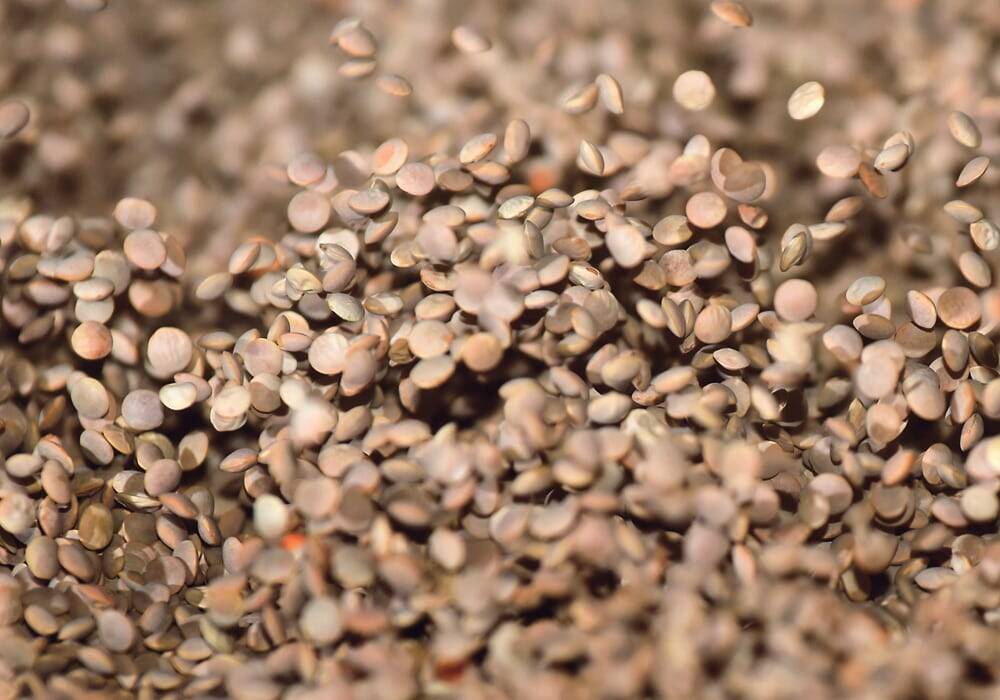
The yields in the RM of Bratt’s Lake (Figure 3) bounce around 30 bu./ac. and do not reach 50 in the highest yielding year. Most money on these soils is made by lentils; it is the perfect soil for lentils. Most of the farm net worth in that RM is likely due to lentils.

Figure 4 shows the soil map for Bratt’s Lake, which is just southwest of Regina; the red colour is for Regina heavy clay. This RM has the best of the best soils: flat land, no stones, high moisture-holding capacity. It is easy land to farm with no bush or other obstructions, so large fields accommodate the modern wide equipment. Fields a mile wide and two miles long (1,280 acres) are common. That makes for very efficient fieldwork.

But it is in the Dark Brown soil zone, where rainfall can often be limiting. If the soil is dry at seeding time and rain is limiting, the heavy clay is no better than sandy soil.
Future articles will provide data from more Saskatchewan RMs. So far, I have not been able to find wheat yields by RM for Manitoba or by county for Alberta. Perhaps a reader will enlighten me if that data exists.