Editor’s Note: Les Henry, the esteemed Prairie soil scientist and our longtime soils columnist, left us on June 14 at age 83. Up until the day before his passing, Les was working on and revising this column for the next (July 11) edition of Grainews. We’ll still have this on paper for you in a few weeks, but we felt the many readers of his column would like to see this now. Les’s self-penned obituary is also available online at this link. Our thoughts and condolences go out to Prof. Henry’s family, friends, colleagues and students on the Prairies and worldwide.
The Saskatchewan Agriculture dashboard provides an excellent source of crop yields by year. Wheat goes right back to 1938, but canola was unheard of at that time. In this piece we will show you canola yields arranged by soil climatic zones (SCZ).
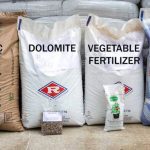
We prepared the map shown below in 1991, as a first step in improving nitrogen fertilizer recommendations. The N-water interaction was well known by that time.
Read Also

Corn research looks for Manitoba-based weed control
Manitoba corn growers rely on U.S. or Ontario weed control recommendations. University of Manitoba researchers are developing weed control advice with Manitoba field conditions in mind.

The Soil Climatic Zone integrates precipitation and temperature into one index. The index was actually calculated in the first Saskatchewan Oil Survey – Report No. 12. It was noted that Melfort precipitation was not that much different than at Swift Current but the soils (Thick Black) and crop yields were much greater at Melfort.
On the reverse side of this map, all the data and procedures were recorded. There were about 200 weather stations at that time. The current federal climate stations in the ag area of Saskatchewan now number about 30.
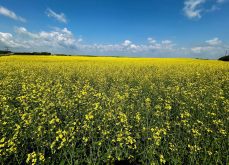
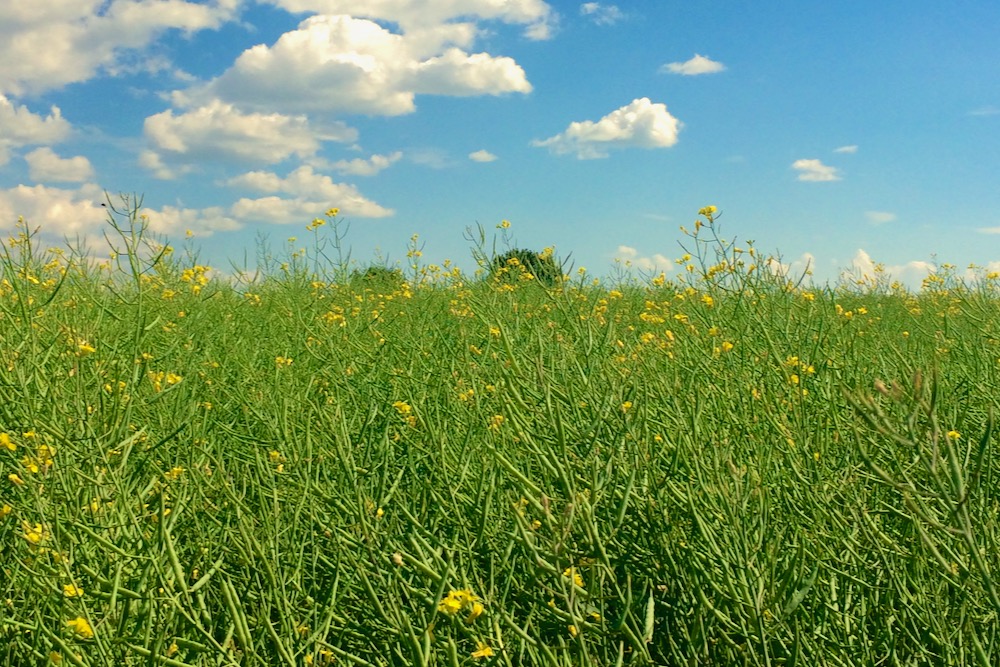
What follows are the graphs showing canola yields from about 1965 to 2023.
Dry Brown SCZ

Brown SCZ

Here, in the RMs of Fox Valley and Kindersley, the recent drought years dropped yields like a stone.
Dark Brown SCZ

Moist Dark Brown SCZ

In both of these graphs the 2001 and 2021 droughts are obvious.
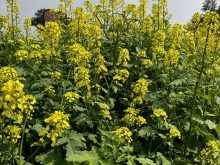
Black SCZ

The Rosthern RM includes some sandy and saline soils.
Moist Black SCZ

This is canola growing country! The 2016 rain gave big yields but the 2021 drought brought yields back a lot.
Grey SCZ

The Grey SCZ is wet, but Grey soils suffer from nutrient deficiencies that require fertilizer to keep yields up.
There is a tendency for yields to increase a lot at about the turn of the century. That could be “nurture”-related — varieties, et cetera — but I expect it is likely “nature”-related to the big 2010 and 2016 rains.
So there you have it: some canola yields to compare over 50-plus years.