In making soil moisture maps as of freeze up the past few wet years, I have come to realize that we should have maps of areas where the surface moisture that we grow crops with has little or no connection to the water table. This piece adds a bit to that idea.
In the 1980s we were busy chasing soil salinity all over Saskatchewan. One area we looked at was the Consul area in deep southwest Saskatchewan. Blair Bachman had been a student and colleague at the University of Saskatchewan, so we spent some time with him to learn about the area. Blair farmed big and was one of those farmers that had a habit of asking tough questions that we had no answer for.
Read Also

Is the technology in our vehicles a help or a hindrance?
Not only does new tech allow people to operate vehicles and farm machinery with fewer skills, it also creates more problems for vehicle users when those systems fail, Scott Garvey writes.
We were scouting one of his fields in spring and I was proudly showing him how our fancy soil probe (Backsaver) worked to determine the depth of moist soil and what that would mean for the current crop. When I found a place where the moist soil went down about three feet I remarked that it would not take much more rain for the surface moisture to join up with the “other” moisture and then he would be good to go.
His very quick response was “What other moisture?” We had our fancy auger rig that would go to 75 feet so had no trouble answering that question. That summer we went to one his summerfallow fields and went searching for the “other” moisture. Guess what? Blair was right. The water table was very deep (I do not remember the exact figure) and on much of his farmland there was likely little connection with the “other” moisture.
Also as part of the soil salinity program we made water well maps for much of the agricultural area of Saskatchewan. These are the only maps of water wells that exist. We had “discovered” the Water Supply Papers that were available for all of Saskatchewan except the northeast. Some areas of Manitoba and Alberta were also surveyed. There was a Water Supply Paper for each rural municipality. These are called the Grey Books. (Henry’s Handbook of Soil and Water tells the complete story of the Grey Books — it’s on page 152 if you have a copy.)
Water well survey
The data for the Grey Books came from a water well survey conducted in 1935 by the Geologic Survey of Canada. 1935 was the middle of the Dirty 30s. Shallow wells were going dry and the feds wanted to get a handle on how bad it was. It was a grand piece of work.
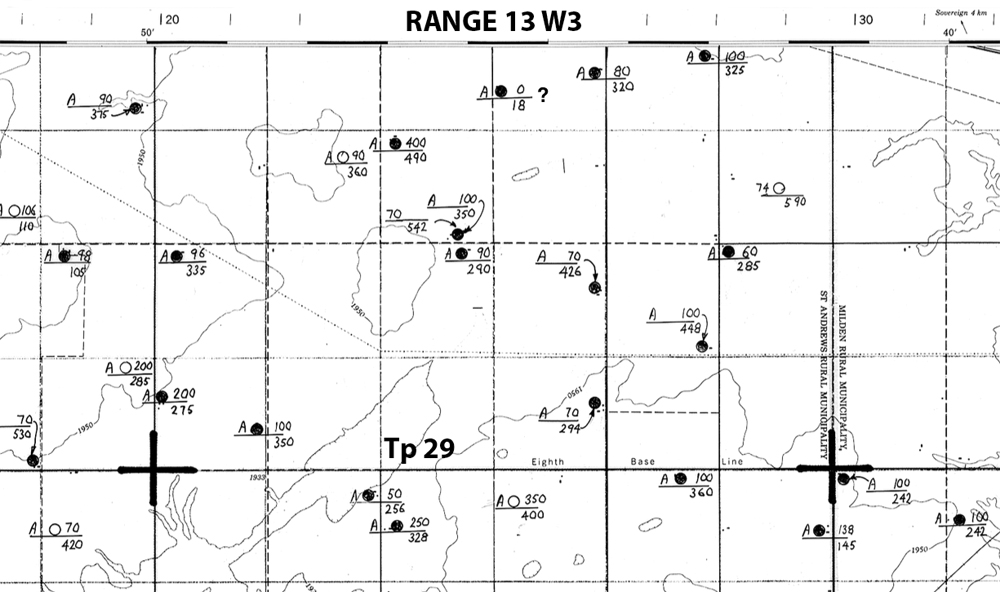
The unique thing about that survey was the density of information — there were many farms in 1935. That was why we prepared the maps. I’ve included a small part of the map west of Milden, where I was raised.
This map shows water wells in Tp 29 R13W3. This is the clay belt. There are no shallow dug or bored wells so there is no near surface water table. I’m not sure about the well on Section 22 — it’s probably in a slough. The question mark is mine.
All wells are deep and the water is a long way down. That means that it is strictly a top-down situation and there is not much help coming from underneath. It is also easy to see that without including the 1935 survey there is not much to map. There are only two wells shown on this map that were dug after the 1935 survey.
In hindsight, if we were to do the soil survey again it should be possible to map the “other moisture” possibilities. With the modern soil maps and with the water well maps and other groundwater information it might be possible, but who is going to do it?
In the meantime, if you would like to peruse the water well map for your area, the good news is that the maps have been scanned and are housed at the Water Security Agency in Moose Jaw. They are not yet on the www.wsask.ca website but a map for you area (if made) will be dispatched by email upon request.
The Water Security Agency website describes the maps and also alerts folks to the limitations of the maps.
To get a copy of the map for your area, make your request by calling 306-694-3900 or emailing [email protected].
If they get enough request for maps, the maps will be placed on the website.