Every cattle analyst has been talking about tight supplies and strong demand. Fundamental analysis can often appear tedious to read. When I’m writing about cattle numbers and consumer spending, I often ask myself if the reader can actually make sense of the overall theme.
While analysts try to simplify terms and economic theory for the average reader, many subscribers call and ask questions proving that I’m not communicating effectively.
When fundamental analysis fails, a picture can be worth 1,000 words. Technical analysis is very useful for the cattle producer when marketing finished and feeder cattle.
Read Also
India likely to triple lentil import duty
Analysts anticipate India hiking duties to 30 per cent after March 31 to bolster domestic prices on expectation of strong harvest.
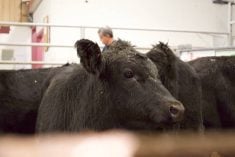
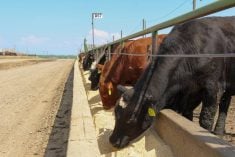
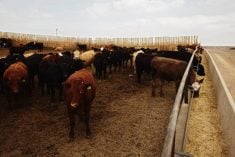
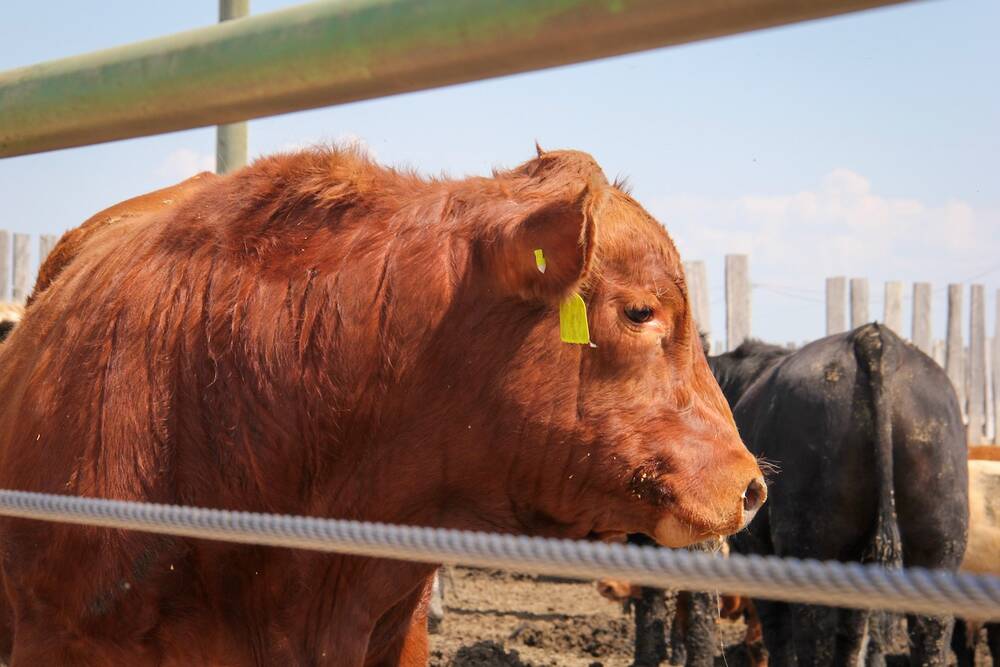
Many finishing feedlot operators realize that when they purchase replacement cattle, the margins don’t pencil out. As Wayne Gretzky stated, “Skate where the puck is going, not where it has been.” As one finished operator stated, “I buy feeder cattle based on where I believe the market will be in the future, not where it has been.” The cow-calf producer needs to also plan marketing on expectations of where the market will be in the future, not where it is today.
Technical analysis is a skill, just like fundamental analysis. It takes years of experience to recognize market behaviour. When you’re married for a long period of time, you become familiar with your spouse’s behaviour and daily patterns.
When you trade a market for an extensive period of time, you become “one” with the market. Each commodity market has its own personality. Just like any business, 20 per cent of the traders conduct 80 per cent of the volume. The combined personality of all these traders is the personality of that specific market. The 20 per cent of the traders have been around a very long time and are also considered the “smart money.”
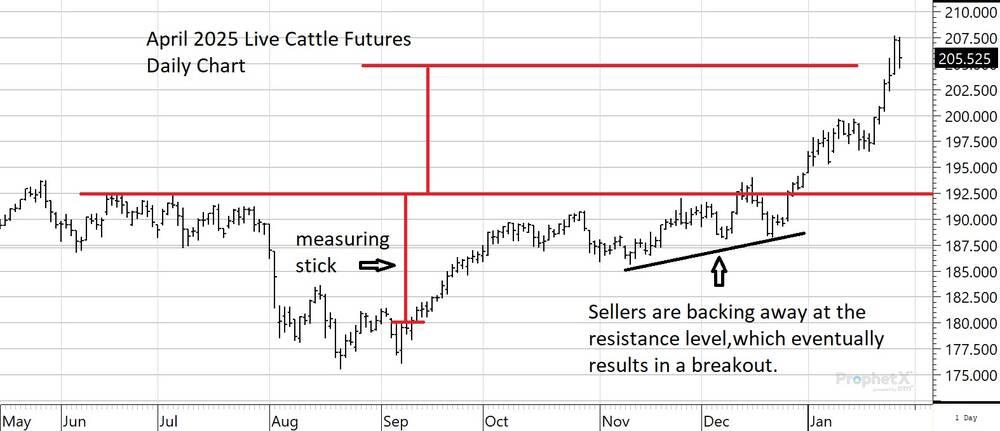
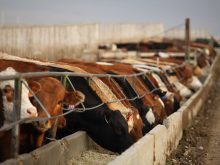
In this article, I’m going to provide technical analysis for the April 2025 live cattle futures. During the winter, this is the most heavily traded contract and is considered the leader. Finishing operators will base their purchasing decisions on the April contract for 800-plus-lb. feeders. April live cattle had resistance at or around $192.50, which I’ve drawn on the chart with a thicker red line (all figures US$ except where otherwise noted). The April contract experienced a dip during August and September before trading back up to the resistance level.
During October, November and December, the market struggled to break above this resistance. This pattern is called a “teacup formation” because it looks like a teacup. Technicians measure from the inside of the “teacup” to the resistance level. This distance from the inside of the teacup is used to project the upside potential.
We measure from the inside low, which is $180, to the resistance, at $192.50, which equals $12.50. We add the $12.50 to the $192.50 to project an upside target of $205. At the time of writing this article, the market had accomplished this objective.
This is very useful for the cow-calf producer deciding when to market their calves. I received many calls throughout the fall from cow-calf operators asking if they should market their calves in the fall or wait until January. I mentioned to these callers that there was a high probability for a rally in the live cattle market during the winter based on this technical formation.
There is one other common way to analyze this chart. The market traded in a range during October, November and December. When a market trades in a range for a long period of time and then breaks out of the longer-term range, there is usually a significant move in the direction of the breakout. During this rangebound trade the lows on each dip were considered higher lows. I’ve drawn this with the black line, which has an upward slope. This tells us that sellers are backing away on each dip. Markets go up because of the lack of selling. Markets go down due to the lack of buying. In this case, producers anticipate a breakout to the upside.
There is an old trading principle which says when a market moves above a key psychological level for the first time in history, such as $200, the market usually has enough momentum to eventually trade eight to 10 per cent above this key level. Time will tell, but this market still has upside potential longer-term. Technical analysis can be a useful tool when planning your strategy for marketing feeder cattle. You don’t need complicated formulas. Experienced technicians can recognize patterns or behaviour of the markets that have a high probability of reoccurring or developing. Cow-calf producers can use this information to plan their marketing strategies. Finishing operators often buy feeder cattle based on where they expect the fed market to be in the future.
Cow-calf producers need to have the same mindset for their marketing. In our example, a $12 move in the live cattle futures would result in an additional Cdn$15 to the western Canadian feeder market, which is exactly what happened in January.