Glacier FarmMedia | MarketsFarm — Agriculture and Agri-Food Canada made several upward adjustments to its supply and demand estimates, after including the data from the Statistics Canada production update earlier this month.
AAFC issued its latest monthly report on the late afternoon of Sept. 26, which incorporated StatCan’s Sept. 17 estimates.
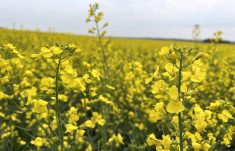
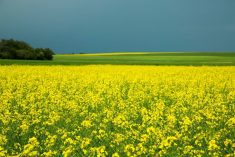
AAFC noted crop yields have been generally better in 2025/26 compared to those the previous year, and in particular that for canola.
“Across Western Canada, the crop experienced hot temperatures during July, followed by more moderate temperatures in August. Moisture conditions were normal to slightly better than normal across the southern half of the Prairies and drier than normal across the northern half of the canola growing region,” the AAFC report said.
Read Also

ICE weekly: War news driving canola markets
Canola futures broke below their nearby trading range as a selloff in crude oil weighed on prices. While seasonal price trends point higher, direction will continue to come from developments in the Middle East.
Of note, the latest StatCan canola production figure of 20.03 million tonnes came in slightly lower than AAFC’s August projection of 20.10 million. The latter was higher than StatCan’s August forecast of 19.94 million tonnes of canola.
Anecdotal evidence has pointed to better-than-expected canola yields, with some market participants calling for production to reach or exceed 21 million tonnes.
StatCan is scheduled to issue its next production report on Dec. 4, which will include the survey results of more than 27,000 farmers.
September estimates for Canadian major crops supply and demand: in million tonnes. Source: Agriculture and Agri-Food Canada.
Grains and oilseeds
Production Exports
2025/26 2025/26 2024/25 2025/26 2025/26 2024/25
July June July June
All wheat 34.433 34.730 34.958 25.700 26.100 27.200
Durum 5.571 5.431 5.870 4.600 4.600 5.400
Barley 7.900 8.080 8.144 2.740 2.840 2.840
Corn 15.450 15.107 15.345 2.300 2.300 2.900
Oats 3.395 3.380 3.358 2.420 2.320 2.470
Canola 17.800 18.000 19.185 6.000 6.000 9.500
Flaxseed 0.315 0.230 0.258 0.225 0.200 0.250
Soybeans 7.425 7.250 7.568 5.650 5.450 5.400
TOTAL 87.454 87.514 89.388 45.235 45.410 50.716
Domestic Usage Ending Stocks
2025/26 2025/26 2024/25 2025/26 2025/26 2024/25
July June July June
All wheat 8.558 8.605 8.463 4.300 4.250 4.000
Durum 0.796 0.806 0.602 0.500 0.450 0.300
Barley 5.560 5.540 5.705 0.600 0.600 0.900
Corn 14.950 14.807 14.741 1.900 1.700 1.600
Oats 0.995 1.080 1.000 0.350 0.350 0.350
Canola 11.900 11.400 11.755 1.100 1.850 1.100
Flaxseed 0.090 0.090 0.092 0.100 0.040 0.090
Soybeans 2.250 2.250 2.465 0.530 0.555 0.555
TOTAL 44.770 44.220 44.621 9.060 9.545 8.705
Pulse and Special Crops
Production Exports
2025/26 2025/26 2024/25 2025/26 2025/26 2024/25
July June July June
Dry peas 3.200 3.125 2.997 2.000 1.650 2.300
Lentils 2.450 2.325 2.431 2.100 2.100 2.000
Dry beans 0.400 0.370 0.424 0.400 0.380 0.400
Chickpeas 0.315 0.265 0.287 0.185 0.175 0.190
Mustard 0.105 0.085 0.192 0.095 0.095 0.095
Canaryseed 0.170 0.125 0.185 0.125 0.120 0.125
Sunflower 0.065 0.051 0.051 0.040 0.030 0.050
TOTAL 6.705 6.346 6.568 4.945 4.500 5.160
Domestic Usage Ending Stocks
2025/26 2025/26 2024/25 2025/26 2025/26 2024/25
July June July June
Dry peas 0.670 0.670 0.612 0.975 1.300 0.425
Lentils 0.300 0.300 0.316 0.530 0.305 0.405
Dry beans 0.060 0.060 0.059 0.065 0.055 0.055
Chickpeas 0.085 0.085 0.081 0.170 0.150 0.085
Mustard 0.044 0.044 0.045 0.125 0.105 0.150
Canaryseed 0.015 0.015 0.014 0.120 0.080 0.090
Sunflower 0.065 0.066 0.066 0.120 0.115 0.135
TOTAL 1.239 1.240 1.193 2.105 2.110 1.345