When soil health and crop management specialist Yamily Zavala earned her PhD at Cornell University, she learned firsthand about the university’s Comprehensive Assessment of Soil Health.
This methodology was developed and first used commercially at Cornell in 2006, incorporating chemical, physical and biological properties to gauge soil health. Since then, this technique for measuring a comprehensive mix of indicators of soil health has been modified to fit locations around the world.
As the soil health lab manager at the Chinook Applied Research Association in Oyen, Alta., Zavala received the green light to modify Cornell’s technique for Alberta conditions, developing the Alberta Soil Health Benchmark.
Read Also
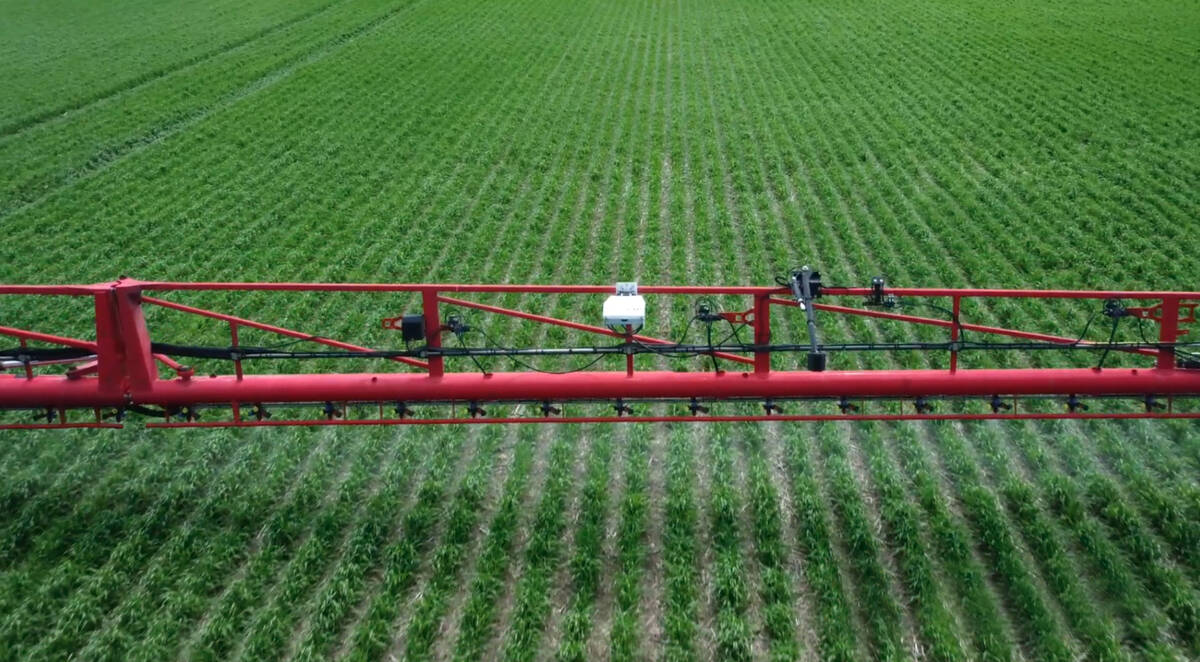
Croptimistic’s SWAT Cam maps one million acres in Western Canada
Croptimistic’s SWAT Cam has mapped more than one million acres, using sprayer-mounted cameras to generate crop and weed maps that support in-season analysis and future management decisions.
“I learned from them everything I needed to put together here,” says Zavala.
Grading on the curve
The Comprehensive Assessment of Soil Health technique and the Alberta Soil Health Benchmark analysis provide test results with handy scores that assess soil using a familiar format — a score from 1 to 100. As well, colour codes make it easy to spot where an intervention or practice change might have the biggest effect.
Zavala and her research team developed scores for each measure based on data collected from 2018 to 2023. During that period, 11 of the 12 applied research and forage associations across Alberta collected soil samples for this project.
Using these results, they calculated the mean and standard deviation based on a standard normal distribution for each test result. Then a scoring curve was developed for each indicator. These scoring curves enable the lab to provide test results that show where your soil fits relative to other soil in Alberta. After analyzing the data, Zavala developed separate scoring curves for coarse, medium and fine soil across the province.
As an example, through these tests, the average soil respiration rate in Alberta was found to be 1.22 mg CO2 per gram of dry-weight soil. If your soil’s test result is 1.22, your score will be 50 out of 100, right in the middle. If your score is above average, you’ll get a score above 50.
Using these curves, each test result has been converted to a score from one to 100, with 100 being the best. Then each test result is colour-coded for convenience. From worst to best, the scores and colours are:
- under 20: red, very low
- 20-40: orange, low
- 40-60: yellow, medium
- 60-80: green, high
- >80: blue, very high
With the colour-coding system, users can quickly see their biggest soil problems and consider potential solutions. Measurements shown in red are constraints, areas where improvement may increase soil health and ultimately yield. Measures in green and blue are areas where growers can sleep easy at night.
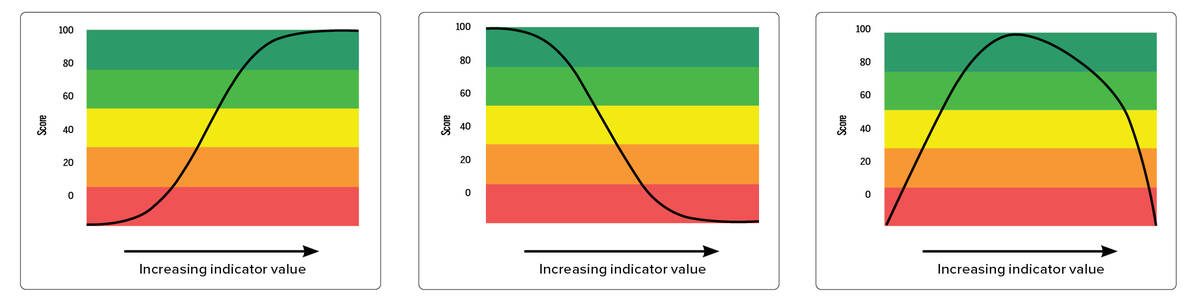
A curve for every test
For most soil health indicators, more is better. A higher test result means a healthier soil and a better score. In these cases, curves are generally shaped like the curve in Figure 1.
For some indicators, such as the amount of manganese or iron in the soil, a lower test result is better. As you can see in Figure 2, curves for indicators where smaller results are better are drawn in the opposite direction, so lower test results bring higher scores.
Sometimes the best test result is in the middle. These cases are shown in Figure 3 as an optimum curve. Soil pH is an example of a measurement in this category. Test results that are very high or very low would return a low score. A score in the middle of these extremes would be in the green zone (high, meaning “good”).
The Alberta scoring curves will change over time. As more soil tests are done, the new data will be built into the scoring curves so farmers can have more accurate results.
Meanwhile in Saskatchewan
To the east, a team led by Kate Congreves, a professor in the department of plant science at the University of Saskatchewan, is working on a Saskatchewan Soil Health Assessment Protocol that includes scoring functions similar to those developed for the Alberta Soil Health Benchmark.
There are subtle differences in this protocol. Rather than creating scores based on smaller regions of the province, the Saskatchewan protocol is developing scoring curves by soil type: brown, dark brown and black. Saskatchewan researchers noted that soil class generally influenced most soil characteristics.
For example, the Saskatchewan report mentions soil organic carbon. Generally, a soil organic carbon of three per cent would be a “good” score in Saskatchewan. But in Saskatchewan’s black soil zone, soil organic carbon levels tend to be higher. In the black soil zone, a soil organic carbon of three per cent would rate as “poor,” with a score between 20 and 40 on the scale of one to 100.
And the rest of the country?
In the spring of 2024, the Canadian Standing Senate Committee on Agriculture and Forestry released a report on soil, “Critical Ground: Why Soil is Essential to Canada’s Economic, Environmental, Human, and Social Health.”
This report includes 25 recommendations, the first of which is that soil be designated as a strategic national asset. Many other recommendations centre on encouraging soil stewardship, using tools like tax credits and carbon markets.
There are many ways to evaluate soil. This report recommends that the federal and provincial governments develop a consensus on how to measure, report and verify soil health.
Zavala would like to see comprehensive soil health testing in place across the country.
“If the government doesn’t see the importance of what we have done in Alberta and look in more detail at how beneficial this can be, we aren’t going to understand what’s happening in our soil,” she says.
“We need to see the soil in a different way.”