
When the three Prairie provinces established provincial soil test laboratories in the 1960s, that was the start of a real advance in learning about potassium (K) as an essential plant nutrient. Until then it was not much of an issue, as many experiments showed no field crop response.
With many thousands of farm field soil tests including K, it was possible to pinpoint where deficiencies were, and do field experiments where problems did exist.
Read Also

War hits farm equipment makers’ share prices
There could be a very rocky road ahead for the U.S. economy, and valuations of U.S.-based corporations, such as major equipment makers, could continue to take a beating, Scott Garvey writes.

Figure 1, based on tests from 19,314 summerfallow and 25,669 stubble fields, shows the 11-year averages from 1968-1979. K soil tests are much higher in the Brown and Dark Brown soil zones. Part of that difference is due to soil climatic parameters, but soil mineralogy is also involved.
Statistical analyses of the annual average suggest a five-pound-per-acre per year decline in soil test K.
Potassium balance: Crop removal, fertilizer addition
The data in Figure 2, prepared by John Heard, now retired from Manitoba Agriculture, shows the extent of the imbalance. We are hauling away much more K than we are applying, so we should expect some consequences as the years roll by. There are similar graphs for Saskatchewan and Alberta for earlier years that show the same trend.
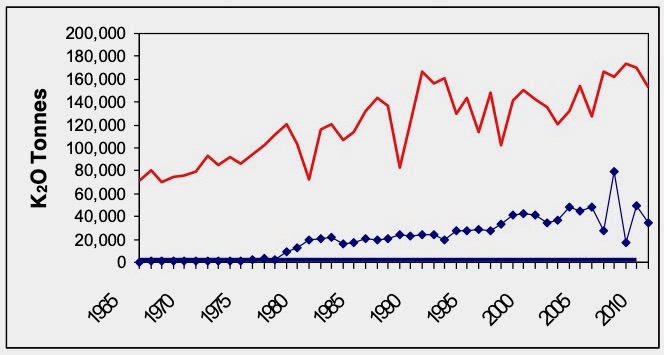
Figure 3, the current soil test summary data by Agvise Laboratories, shows the soil K situation after the 2023 crop. Saskatchewan has other older data showing K deficiencies in that province’s northwest and north-central regions.

K removal different than N and P
For N and P, about two-thirds of the nutrient is in the seed and about one-third in the straw. For K that is reversed, with about two-thirds or more ending up in the straw. The K in the straw is not tied up, so it easily washes out with a rain. Thus, K leached from the straw can be a source for the next crop. Even leaf drop from canola can add some available K. If you swath canola and see a better crop next year where the straw rows were, it could well be a K fertilizer effect.
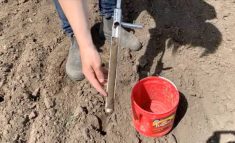
Burn rows for tree clearing can also be a significant source of plant nutrients, including K. In an example on a K-deficient soil east of Hudson Bay, Sask., the strip test plot area had a K soil test of 93 kilograms per hectare in the zero- to six-inch depth, but a nearby burn row had a soil test of 215 kg/ha.
Barley most affected by soil K deficiency
Barley is more sensitive to K deficiency than wheat and other crops. Rigas Karamanos, of what was then Westco Fertilizers, did many experiments comparing crops and concluded some seed-placed K was a good practice for barley — especially malt barley.
What does K deficiency look like, anyway?
Potassium is mobile in the plant, so K moves from the older leaves to the newer growth, and deficiency symptoms show up on the oldest leaves.
As shown in Figure 4, the oldest leaf scorching starts at the tip and moves down the margin until it has comsumed the leaf, then moves on to the next leaf.

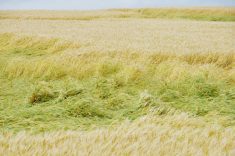
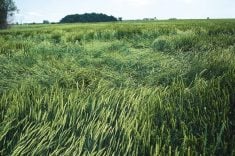
No K, no barley. It took 400 pounds per acre of 0-0-60 to get 50 bushels per acre of barley on the very K-deficient Carrot River soil shown in Figure 5 (up top).
After several years of such experiments, I could check out a field and make a good guess if K was a problem.
So, there you have it. If you have never used K fertilizer, maybe now is the time to take a second look. In many fields we have been mining K for decades now, so K may be needed now where it was not at one time.
Full disclosure
I am a Saskatchewan taxpayer, and our provincial coffers benefit greatly from potash royalties. We sit on one of the world’s best potash beds, about a kilometre down, all along the Yellowhead Highway from Saskatoon to the Manitoba border.
I do not own shares in any potash mines.