The feature “Catalogue houses: Eaton’s and others and how it all happened” in the November 2021 issue of Grainews, gave a blow-by-blow account of how my book on the topic came about. The response has been tremendous, and many thanks to readers. Your letters, emails and book orders are very much appreciated.
In this piece, we will look at how the first soil moisture map happened.
Soil moisture maps
To make a soil moisture map, one must understand soil moisture. For that, I credit soil physicist Eeltje de Jong, who arrived at the University of Saskatchewan just as I finished my bachelor of science in agriculture and was starting a master’s degree. He remains my “go-to” guy for any soil moisture question I struggle with.
Read Also
Sask., Alta. farmers get strychnine against gophers until late 2027
Farmers in Saskatchewan and Alberta are cleared to use strychnine this year and next year against gophers wrecking their fields and pastures.
When he arrived at U of S, the first thing Eeltje did was take a good cross-section of Saskatchewan soils and determine the field capacity, wilting point and, hence, available water. That gave us benchmarks to proceed with.
In the 1970s, the Soil Science department at U of S had dozens of soil management and fertility experiments all over the province. Most of that work included measuring soil moisture at least at seeding and harvest. A reduction in the practice of summerfallow was a big objective and that required work on actual farms.
My job at that time was refining the soil test benchmarks, including the fledgling South Saskatchewan Irrigation District. When moisture was not a limiting factor, fertility took on a whole new life. Being able to vary both moisture and nitrogen on the same plot in the same year allowed us to refine the dryland recommendations based on known soil moisture and probability of precipitation.
The Backsaver soil probe was a major advancement. It let us investigate soil moisture to a depth of four feet without the need of a soil coring truck. Of course, that was the case if the soil was moist (that is, at field capacity soil moisture). When we reached dry soil, the probe would not penetrate. It is all about measuring and mapping the wetting front.
It is also all about subsoil moisture below six inches. Surface moisture is here today and gone in a few dry days with wind. That is exactly what happened in 2021. For crops not seeded in very early May, the seed lay in dry soil until the May 24 rains, so that was the effective seeding date.
Our crops usually quit using water in late July to mid-August. The start of fall rains is the start of soil moisture storage for the next year’s crop. At that time, I was pounding a lot of pavement (and gravel) and I used the soil probe to determine the wetting front from fall rains. When a soil is dry and rain happens, that rain wets the soil to field capacity to a depth determined by the moisture holding capacity of that soil. For a sandy loam soil, each inch of water will advance the wetting front about one foot.
Those lucky folks who have a copy of Henry’s Handbook of Soil and Water can check out page 107 to see how it all works.
Fall rains are mostly system rains rather than thundershowers that occur in summer months. As I was probing soils, I soon learned the wetting front had little variation over wide areas. One probe in a quarter section was as good as 100. I recall probing soils on the farm I was raised on at Milden, Sask., and driving 20 miles to Rosetown and getting the same answer. They were both clay soils, so if they had the same rain, the wetting front was the same.
It is all about fall rains. If we want to make a map of fall soil moisture, we need a good map of the rainfall that occurred after the crop quit using water. That data came from the Saskatchewan Agriculture weekly crop report. Sask Ag crop reporters recorded rainfall each week and there were approximately 300 of them at that time.
I would set up a spreadsheet showing rainfall as of the start of recharge (usually about August 15) and as of the current date. The difference was plotted, and the map was prepared according to the legend that was established. No Excel spreadsheet at that time — just paper and a hand calculator.
First stubble soil moisture map, 1978
In the 1970s, the Agriculture Canada research station at Saskatoon made a province-wide grasshopper map that was displayed on all grain elevator walls by late fall. I consulted with them and used the same base map for the soil moisture map. At that time, there were hundreds of grain elevators all over the ag area of Saskatchewan.
The first hand-drawn map was made by mid-October of 1978. There was no committee — I just went ahead and did it. One morning at about 11 a.m., I took a draft copy to Don Rennie’s office (the department head) and showed him what we had done. With little hesitation, he said, “If you can make a map like that, we will find the money to publish it.”
That afternoon at coffee break, Don said, “We have the money — get on with it.” One quick call to Vic Beck in Regina (Sask Ag) and the money was there. With much help from the U of S extension division and elevator companies, that map hung proudly on elevator walls all over the province during late fall and winter of 1978-79. Almost all farmers would have seen it. The small-town elevators were the “go-to” place at that time.
That is the way things were done in those days. In today’s world, it would take that long to decide who should form the committee to decide if it should be done.
Importance of freeze-up soil moisture map
If the soil is full of water by freeze-up, that subsoil moisture will still be there until a plant root comes looking for it the next year. As long as that root is a crop and not a weed, we are in business. Much of the crop input planning happens over the winter months. Subsoil moisture is a known quantity that can be banked on. In a business with so much uncertainty, why not grab onto something that is certain.
When we made the first map, we were under no illusion it would be 100 per cent accurate for all farms across the province. What it was intended to do was provide a framework to think in and to encourage farmers to do soil probing to determine what was on their farms. While many farmers and agrologists did soil moisture probing, it was not adopted as much as I had envisaged. The advent of recording soil moisture probes that can be integrated with a cellphone is now creating much interest in knowing soil moisture on individual farm fields.
In making the early maps, the assumption was the crop had removed all available moisture to a depth of four feet. By mapping the wetting front of fall rains, it was a “top-down” approach. If probing showed a soil moist to about three feet, we would try to “push through” the dry layer to see if there was any residual moisture at depth.
We now know that the dry layer is the thing to know. If the dry layer is small it will not take much more rain to join up the moist layers and the soil will be “full.”
I never had much appetite for trying to make a spring soil moisture map. It would be out of date by the time you assembled it. It is up to growers and consultants to check it out in the spring.
The map legend
The image below is the legend for the first ever Stubble Soil Moisture Map. Reducing summerfallow acreage was a main thrust when the first map was made. Snow management practices were suggested when soil moisture was low.
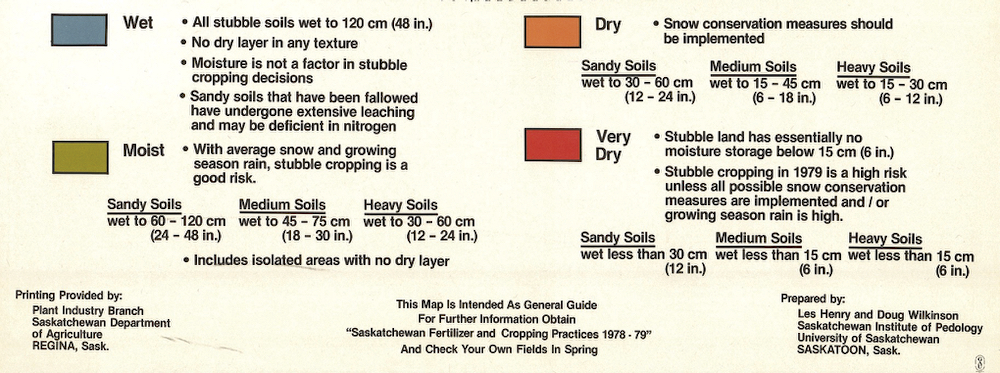
Study the legend carefully. It is all about mapping the wetting front and converting that to inches of available water for the soil texture. That is why it is not possible to make a map showing inches of available water without also having a soil map.
The three-pail analogy
We have done this before but it is worth repeating. We separate soil texture into sandy-, medium- and heavy-textured soils. Let us now assume three pails that hold four, six and eight gallons of water. If we add four gallons of water to each, they will all have the same amount. If we add six gallons, the four-gallon pail will have only four. If we add eight gallons, the four-gallon pail will still have four gallons, the six-gallon pail will have only six and only the eight-gallon pail will have eight gallons.
In the pail analogy, the water would spill out the top, but in the soil the extra water will go deeper. When it reaches the water table, the water table will rise. It is only in the wet years from 2010 to about 2016 that we have realized the role the water table can play in feeding crops.
Changes over the years
In Saskatchewan, we were the first, but Alberta soon joined in and made a soil moisture map as of freeze-up. They did a survey by probing soils in townships on a grid basis. For several years, Joe Michielsen and I had a phone call in early November to compare notes along the border. This process meant our maps lined up at the borders. Manitoba was not as anxious to make a map — and for good reason. All of Manitoba is in the black or grey soil zones, so soil moisture is usually less of an issue. In the past, for many years, Manitoba has produced a fall soil moisture map.
The first three-province soil moisture map in Grainews was the map as of November 1, 2002. In the wet years, from 2010 to approximately 2016, we added a fifth category to recognize areas where the water table was a factor in supplying water to growing crops. There is no need for that category for the November 1, 2021, Soil Moisture Map, which will appear in the January 18, 2022, edition of Grainews.
So there you have it. How it all happened to make maps of soil moisture as of freeze-up.