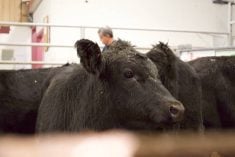

The most recent USDA Cattle on Feed report released in January showed the total number at the beginning of the year at 12.037 million head, up one per cent from Jan. 1, 2021.
Initial media and analytical reports were calling the report bearish. This is the second-highest Jan. 1 inventory since the series began in 1996. However, instead of being bearish, the futures market has been quite firm and made fresh contract highs after the report.
At the same time, the cash market in the U.S. has been slowly trending upward. False analysis can cause producers to make hasty, emotional marketing decisions. For example, if a producer had a group of feeder steers to sell, these comments might persuade them to sell sooner rather than later.
Read Also
India likely to triple lentil import duty
Analysts anticipate India hiking duties to 30 per cent after March 31 to bolster domestic prices on expectation of strong harvest.
In this example mentioned above, the feeder cattle markets in the U.S. and Canada have also been slightly higher since the report. After it was released, my take was that it report was actually neutral to slightly friendly for the market.
I received many calls asking for my reasoning behind this analysis. Over the years of writing for Grainews and Canadian Cattlemen, I’ve realized that many cattle producers and market commentaries provide inaccurate analysis for Cattle on Feed reports. Consider this April column as an Agriculture Economics 101 course for these reports.
Plenty of data
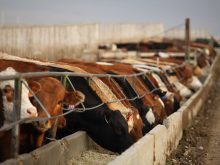
The USDA Cattle on Feed reports include a significant amount of data. On the first page is an overview which includes the total number on feed along with placements and marketings during the previous month. Usually on page five or six, the report has feeder cattle placements by weight category for the current month, the previous month and the same month of the previous year. The reports have data from all feedlots with 1,000-head-plus capacity. This composes about 82 per cent of the total number of cattle on feed for slaughter in the U.S.
A Cattle on Feed report is considered bearish under two conditions. First, the fed cattle marketings number has to be lower than expected. Second, placements in the heavier weight categories have to be sharply above year-ago levels. These two factors would suggest there is a buildup of market-ready supplies in the short term.
The next exercise is most important for determining the supply equation for the market structure. The older generation like my dad had to do this by hand with a pencil and calculator, but a simple spreadsheet makes this much easier. The point of the exercise is to determine how many cattle will be available for the fed cattle market at a specific period in the future.
The accompanying chart below shows placements by month by weight category. Each month, the producer has to keep track of the total number of cattle in each weight category and also the difference from the previous year. If I want to forecast the number of cattle that will be ready for the slaughter market in February, I start by looking at the feedlot placements under 600 pounds during June.

In this example, feedlot placements during June were 345,000 head, which was down 85,000 head from the previous year. For simplicity, we calculate the cattle will gain three pounds per day. Cattle under 800 pounds are probably gaining 2.4 pounds per day on average but above 800 pounds, they’re probably gaining 3.6 pounds per day. It averages out.
During July, I look at the cattle placed in the 600-699 pound category. In this example, feedlot placements during July were 255,000 head, down 60,000 head from the previous year. In July, the analyst would look at the placements in the 700-799 pound category and in August, one would look at the placements in the 800-899 pound category and so on. By the end of this exercise, you would the total number of cattle that would be available for the slaughter market in February of 2022. You would also have the difference from the previous year.
If I add up the total number of cattle that will be available for the February slaughter, the sum is 1.858 million head. This is down 149,000 head from the previous year. This information alone tells you that the report is not bearish, but we can take this a step further. The USDA Cattle on Feed report composes 82 per cent of the total number on feed. If we divide the 1.858 million head by 82 per cent, the total is 2.265 million head.
When this article was written a bit earlier this year, the weekly U.S. slaughter under federal Inspection was averaging about 640,000 head per week. If this pace continues, the total would be 2.560 million head. If we add about 60,000 head of U.S. fed cattle and imports from Canada of 60,000 head then the total commercial slaughter is about 50,000 head above the federally inspected slaughter. There is total supply of 2.375 million head and a total demand of 2.560 million head.
Numbers indicate bullish market
One can see that the fed cattle market is not bearish under this scenario but rather bullish. Analysts that were calling this Cattle on Feed report bearish were wrong. As side note, a Cattle on Feed report seldom has a large influence on the market in the short term because the cattle coming on the market were placed in previous months.
You can see in the data above, there was a sharp year-over-year increase in the lighter-weight categories during December. This resulted in a year-over-year increase in total cattle on feed numbers. However it looks like we’ll see a year-over-year decrease in the heavier weight categories in subsequent reports. Therefore, it’s a non-event.
Keeping track of placements by weight category is extremely important for cow-calf producers to determine the timing of your sales. For finishing feedlots, it’s important for your overall risk management strategy. In AgEcon 202, we take this a step further and balance the placement data with the total calf crop from previous year — that’s a column for another day.