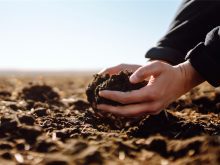
Every farmer wants “healthy soil.” But what does that mean, and how do they know if they have it?
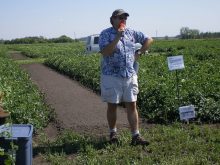
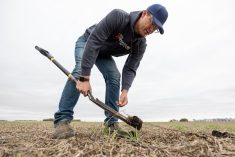
“The first question I ask when I’m speaking to farmers is, ‘How many of you have done soil testing?’” says Yamily Zavala, PhD, soil health lab manager and soil health and crop management specialist at the Chinook Applied Research Association, Oyen, Alta.
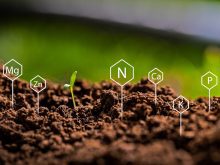
Most farmers in the room raise their hands when she asks this, but when Zavala pushes them further, she finds that most of the growers have actually had an analysis of the chemical properties of their soil. These tests usually analyze micro and macronutrients, pH, organic matter, electrical conductivity (to indicate salinity), and cation exchange capacity (to indicate the soil’s ability to hold nutrients).
Read Also

Recall petition against Alberta agriculture minister comes up short
The recall petition launched last November against RJ Sigurdson, Alberta’s minister of agriculture and irrigation, has failed to gather enough signatures by its deadline to proceed further.
This information is necessary to develop a fertility program, but, Zavala says, it’s far from the whole story. “Soil is not just chemicals. Soil is not just minerals. Soil is holistic. It’s alive.”
The Chinook Applied Research Association’s Soil Health Lab has been testing soil from across Alberta using three categories of soil properties: chemical properties, as well as physical and biological properties. With more than 4,000 soil samples analyzed between 2018 and 2024, the includes benchmarks and scoring systems that can provide Alberta growers with comprehensive reports on their soil health in an easy-to-use format.
What is “healthy”?
There isn’t one standard, simple definition of “healthy” soil. Most definitions mention the soil environment and how efficiently the soil cycles nutrients. Almost all definitions use “healthy soil” and “quality soil” interchangeably.
The concept of soil health goes beyond measuring the chemicals and nutrients in the soil and includes how the whole soil ecosystem is functioning.
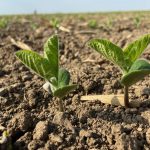
One common indicator of soil health measures the amount of living microbes in soil. This is soil organic matter, the percentage of soil made up of plant and animal material. Soil organic matter is the basic building block of productive soils, holding the soil together and making soil’s biological functions possible.
We know that a higher percentage of soil organic matter is better. But how much is enough? What other components of soil affect soil organic matter?
Is there an optimum health level for soil? It’s unlikely that soil can be too healthy. Most of us just want to know if our soil health is trending in the right direction, and how the soil we’re managing compares to other soil in the area under different management.
What can we measure (besides soil organic matter) to get a good picture of trends, and analyze differences?
Three components of soil health
The theory behind the Alberta Soil Health Benchmark is that healthy soil has three general components. These are the chemical and fertility properties, the physical properties and the soil’s biological properties, such as soil organic matter.
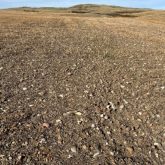
The physical properties describe the inherent character of the soil. Indicators include soil texture, compaction, water infiltration, bulk density (an indicator of soil compaction) and soil wet aggregate stability.

Growers can change some of these physical properties over time through management changes. Other physical characteristics are permanent. Physical properties can constrain soil health and crop yield.
Improving the soil’s physical properties can also improve some of the chemical indicators, the soil organic matter, and other biological indicators. Zavala describes this as “building a really nice house for the biology.”

The third part of the Alberta Soil Health Benchmark evaluation is the biological component. “The creatures in the soil cycle nutrients,” Zavala says. “This cycle is what makes the soil alive.”
Zavala sees all three of these components as important and necessary for soil health, but sees biology as “at the top.” Organic matter in the soil is what allows the soil to function as an ecosystem. The living organisms in the soil are dynamic, changing all the time.
When all three of these components are robust, Zavala says, “that’s what I call the healthy soil.”
Together, all three of these types of measures provide a snapshot of the health of the soil. With repeated, consistent tests over time, changes in these measurements will indicate where farm management is improving or depleting soil health.
Measuring biological health
Of course, soil organic matter is a key indicator for measuring soil’s biological health. Soil organic matter is measured by drying the soil, weighing it and then heating it to a temperature that will burn off the organic matter. The remaining soil is re-weighed; the difference in weight is the organic matter. The measure is provided as a percentage of the total soil mass.
The soil organic matter includes many living organisms. Some of the smallest are bacteria and fungi. These produce their own secondary metabolites and digestive enzymes, they absorb pieces of plant residue, and they release nutrients that plants can use. Among farmers and agronomists, nitrogen-fixing bacteria such as rhizobium are probably the most popular creatures in this category. Nitrogen-fixing bacteria convert atmospheric nitrogen to ammonia, a form of nitrogen that can be converted into plant-available nitrogen.
Protozoans in the soil are generally larger than bacteria and fungi and can move themselves through the thin film of water in the soil. They’re single-celled, but typically bigger than bacteria and fungi. They often consume bacteria, and sometimes fungi. This group of microbes (living organisms too small to see without a microscope) includes flagellates, amoeba and ciliates.
Nematodes are the largest microbes in our soil. They have multiple cells and can consume bacteria, fungi and protozoa. Most nematodes are beneficial to soil health, but some are agricultural pests that take nutrients from plants, such as cereal cyst nematodes. A diverse group of nematodes in the soil is thought to indicate a healthier soil.
Measuring soil organic matter measures the amount of life in the soil. Other tests examine what that life is actually doing under there.
Soil respiration is a measurement that captures a snapshot of the organisms’ metabolic activity. Soil respiration is measured by air-drying soil, rewetting it, putting it in an air-tight container, and then measuring the amount of CO2 produced by the rewetted soil. Results are provided as mg of CO2 per gram of dry-weight soil.
When the microbes are more active, they release more CO2. Some ways growers can increase soil respiration include adding more organic material to the soil, adding manure or cover crops, or diversifying crops. Too much tillage can lower the soil respiration rate.
Active carbon measures the share of soil organic matter that can serve as an immediate food source for living organisms — decomposed matter that plants can consume quickly. A high active carbon test result means the microbes have enough food and are producing matter useful to plants.
Active carbon is measured by adding purple potassium permanganate to the soil. Active carbon causes the purple solution to lose its colour. The amount of active carbon in the soil correlates to the amount of colour change. Active carbon is a useful early indicator of changes to soil health. This test will show the effects of a management change sooner than changes to soil organic matter measurements.
Adaptation
These tests and methodologies are not new or unique to Alberta. The comprehensive list of tests used by the Alberta Soil Health Benchmark study has been adapted from Cornell University’s Comprehensive Assessment of Soil Health. Cornell developed this method of incorporating chemical, physical and biological properties to gauge soil health. The Comprehensive Assessment of Soil Health was first used commercially at Cornell in 2006. Since then, Cornell has assessed more than 10,000 soil samples. And Cornell’s technique for measuring a comprehensive mix of indicators of soil health has been modified to fit locations around the world.
Conveniently, Zavala earned her PhD at Cornell University, where she learned about the Comprehensive Assessment of Soil Health techniques firsthand.
“I got the baseline,” she says. When Cornell gave her the green light to modify its technique, Zavala adapted the methodology for Alberta conditions. “I learned from them everything I needed to put together here,” Zavala says.
Grading on the curve
As anyone who’s looked at an elementary school report card in the past few years will understand, seeing a long list of unfamiliar indicators on one piece of paper can sometimes leave you more confused than informed. It can be difficult to know whether you need to make changes, and even harder to figure out where to start.
The Comprehensive Assessment of Soil Health technique and the Alberta Soil Health Benchmark analysis provide test results with handy scores that assess soil using a familiar format — a score from 1 to 100. As well, colour codes make it easy to spot where an intervention or practice change might have the biggest effect. In other words, deal with the red ones first.
Over time, soil-testers will see trend changes in their scores, as (hopefully) scores increase from year to year as land management practices evolve. But even in the short term, the scores can tell you how well your client’s soil is doing compared to other soils in Alberta and in their local area.
To make this work, Zavala and her research team developed scores for each measure based on data collected from 2018 to 2023. During that period, 11 of the 12 applied research and forage associations across Alberta collected soil samples for this project. Members from each of these associations were well-trained in soil sampling, to ensure consistent results across the province and across the years.
Using these results, they calculated the mean and standard deviation based on a standard normal distribution for each test result. Then a scoring curve was developed for each indicator. These scoring curves enable the lab to provide test results that show where your client’s soil fits relative to other soil in Alberta. After analyzing the data, Zavala developed separate scoring curves for coarse, medium and fine soil across the province.
Let’s look at an example. Through these tests, the average soil respiration rate in Alberta has been found to be 1.22 mg CO2 per gram of dry-weight soil. If your soil’s test result is 1.22, your score will be 50 out of 100, right in the middle. If your score is above average, you’ll get a score above 50.
Using these curves, each test result has been converted to a score from one to 100, with 100 being the best. Then each test result is colour coded for convenience. From worst to best, the scores and colours are:
• under 20: red, very low
• 20-40: orange, low
• 40-60: yellow, medium
• 60-80: green, high
• 80: blue, very high
With the colour-coding system, users can quickly see their biggest soil problems and consider potential solutions. Measurements shown in red are constraints, areas where improvement may increase soil health and ultimately yield. Measures in green and blue are areas where growers can sleep easy at night.
A curve for every test
For most soil health indicators, more is better. A higher test result means a healthier soil and a better score. In these cases, curves are generally shaped like the curve in Figure 1.

For some indicators, such as the amount of manganese or iron in the soil, a lower test result is better. As you can see in Figure 2, curves for indicators where smaller results are better are drawn in the opposite direction, so lower test results bring higher scores.

And of course, sometimes the best test result is in the middle — not too high and not too low. These cases are shown in Figure 3 as an optimum curve. Soil pH is an example of a measurement in this category. Test results that are very high or very low would return a low score. A score in the middle of these extremes would be in the green zone (high, meaning “good”).

These curves have been designed using the same methods used by Cornell University. It was necessary to adapt the curves because Cornell’s benchmark data is based on data in the northeast U.S., where soil is very different from the soil in Alberta. This methodology has been adapted for locations around the world, by developing scoring curves based on local data.
The Alberta scoring curves will change over time. As more soil tests are done, the new data will be built into the scoring curves so farmers can have more accurate results.
The way it WAS
As an example of how these curves and colour-coding work, let’s look at results from wet aggregate stability tests in Alberta, known as WAS scores.
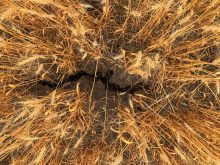
Aggregates in soil are the different-sized “crumbs” that form when soil particles bind together. In healthy soil, biological activity helps the aggregates stabilize and stay together. Too much tillage can break down these aggregates, increasing the risk of soil compaction or erosion. Farmers can build soil aggregates by adding animal manure or cover crops with fine roots to the soil and increasing the biological activity.
WAS measures how well soil aggregates hold together when the soil gets wet. In a lab, WAS is measured by simulating rainfall on soil placed on top of a sieve. Unstable aggregates will break apart and fall through the sieve holes. The share of the soil that stays on top of the sieve is the aggregate stability, provided as a percentage. Using the scoring curves, the Alberta Soil Health Benchmark study will convert that WAS percentage to a score from one to 100.
Because soil aggregates tend to be correlated with soil type, the Alberta WAS data has been analyzed separately for coarse, medium and fine soil.
For coarse soil, the average WAS test result was 48 per cent, meaning that when medium-texture soil is tested, almost half (48 per cent) of the sample stays on top of the sieve during a simulated rainfall.
The scoring curve converts that result into a score of 50, right in the middle of the yellow zone. The soil health report would call it “medium,” and this section of the report would be coloured yellow.
If your client’s WAS test result was 60 per cent, with 60 per cent of the soil left on top of the sieve, the benchmark score would be 70, and this section of the report would be coloured green, for “high.” It would take a test result below 19 per cent to have this section of the report coloured in red.
Comparing your client’s soil to a more local benchmark will give a different benchmark score for the same test result.
On average, soils in the Foothills Forage and Grazing Association area, in southwest Alberta, have much higher WAS test results. Here, a WAS test result of 48 per cent for coarse soil would give your client a benchmark score of only 25, in the orange (“low”) zone. These regional scoring curves allow you and your client to compare their soil to other soils in their area, soils that are probably similar to what you’re dealing with.
To get a score of 50 in the Foothills Forage and Grazing Association area, the WAS test result for coarse soil would need to be 65 per cent. Zavala and her colleagues attribute these higher regional WAS scores to land use patterns in the area. There is more pasture there, and less disturbed area.
In case you were wondering, in the northeast U.S., WAS results tend to be lower. A WAS result of 48 per cent would be in the blue, “very high” zone, and give you a local benchmark score of 80.
Sending in samples
Before sending a sample in, remember that any soil test is only as good as the protocol used to collect the soil samples. The Chinook Applied Research Association’s Soil Health Lab Protocol is available on the lab’s website. This protocol includes all the necessary information from field site selection, to tools, to how best to package your samples for mailing.
The current price for a benchmark assessment is $210 per sample for the biological and physical portion of the tests, plus an additional charge for chemical/fertility tests. This additional charge starts at $60 per sample, with prices depending on the exact list of chosen tests, and the chosen lab.
The forms note that this price is “still a good deal,” and that discounts may be available for special projects. This rate is not near the full cost of performing all these tests and sending you a handy list of results. Zavala explains that they aren’t charging the actual cost of the service now out of fear that “people aren’t going to do analysis because it’s going to be too expensive.”
Once the soil reaches the Soil Health Lab, a portion of the sample will be air-dried and sieved for biophysical tests. Another portion will be stored at 4 C for biological tests. For chemical testing, soil samples will be sent to the A&L Lab and the University of Alberta lab.
Once you get the results, you may see more than one indicator in the red zone, or maybe the orange zone. Sometimes, unfortunately, growers looking for areas to improve are spoiled for choice. And, of course, areas where test results are poor will be correlated. For example, a physical soil constraint makes it hard for microbes to thrive.
The colour-coding on a detailed soil health report identifies areas where management changes could have the most effect. But even with this easy-to-interpret result, not all growers will address every area of concern when they first see the results.
The Cornell manual not only suggests methods of addressing some of the indicators of poor soil health these tests identify, it also includes a discussion on the three main categories of factors that go into a soil management plan.
Soil health status is an important part of a soil management plan, but it’s not the only component. Grower goals and farm resources are also important considerations. A grower renting farmland may be more focused on maximizing short-term yields than on optimal long-term health scores. Or, after two years of drought, a grower may want to implement all of the recommended changes to improve soil health, but simply not have the financial resources to make the changes.
Meanwhile in Saskatchewan
To the east, a team led by Kate Congreves, a professor in the department of plant science at the University of Saskatchewan, is working on a Saskatchewan Soil Health Assessment Protocol that includes scoring functions similar to those developed by the Alberta Soil Health Benchmark project.
The project is very similar to the Alberta Soil Health Benchmarking project, but there are subtle differences. For example, rather than creating scores based on smaller regions of the province, the Saskatchewan protocol is developing scoring curves by soil type: brown, dark brown and black. Saskatchewan researchers noted that soil class generally influenced most soil characteristics.
As an example, the Saskatchewan report mentions soil organic carbon. Generally, a soil organic carbon of three per cent would be a “good” score in Saskatchewan. But in Saskatchewan’s black soil zone, soil organic carbon levels tend to be higher. In the black soil zone, a soil organic carbon of three per cent would rate as “poor,” with a score between 20 and 40 on the scale of one to 100.
And the rest of the country?
In the spring of 2024, the Canadian Standing Senate Committee on Agriculture and Forestry released a report on soil.
This report includes 25 recommendations, the first of which is that soil be designated as a strategic national asset. Many other recommendations centre on encouraging soil stewardship, using tools like tax credits and carbon markets.
There are many ways to evaluate soil. Many tools are not as comprehensive as the Alberta Soil Health Benchmark. Many are similar, but slightly different, like the difference in regional scoring between Alberta and Saskatchewan. This report recommends that the federal and provincial governments develop a consensus on how to measure, report and verify soil health.
Zavala would like to see comprehensive soil health testing in place across the country.
“If the government doesn’t see the importance of what we have done in Alberta and look in more detail at how beneficial this can be, we aren’t going to understand what’s happening in our soil. We need to see the soil in a different way.”
What’s going on down there?
Adding biological measures to soil tests has proven to be fascinating for researchers, including Yamily Zavala.
Using a microscope to visually examine the microbes living in the soil takes more time than the physical and chemical soil tests, but it’s also more rewarding. Soil is filled with a vital network of bacteria, fungi, protozoa and nematodes.
These microbes, along with other living things, such as earthworms and insects, are also called the “soil food web.” A healthy soil food web supports several functions, such as decomposing organic matter, helping plants access nutrients, stabilizing the soil structure, detoxifying the soil, and more.
Of all the microbes, Zavala is especially taken with the protozoa. “It’s so much fun to watch them,” she says. Protozoa are the single-celled organisms that consume bacteria. This class includes several types of organisms including flagellates, ciliates and amoeba.
Soil samples destined for biological analysis are stored in the fridge at 4 C. When it’s time to view the samples, the soil is placed in a plate with 24 wells (not completely unlike a tiny ice cube tray), and incubated for a few days in an agar broth, a solid growth medium that Zavala describes as a “nutrient soup.”
One indicator of soil health is the biomass of all living organisms in the soil. Another is the diversity of this underground ecosystem.
For now, there are no quantitative measures of microbe diversity. As a qualitative measure, Zavala classifies the organisms in the samples based on size, and also by colour, and makes careful notes about each sample.
A more diverse group has a wide mix of sizes and shapes, and a range of colours. These organisms tend to range from two to three micrometres to flagellates longer than 18 micrometres. In colour, these organisms tend to be clear, yellow, brown, black and sometimes burgundy.
It’s not an official part of the test, but Zavala’s favourite part of this assessment is watching the living creatures interact. One day she spotted a group of nematode-trapping fungi. These fungi are carnivorous, and release pheromones to sense and draw in their prey. While Zavala was watching, they formed a circle. “The nematode was swimming and passed inside the circle,” Zavala says. Then, the circle of fungi closed in and trapped the nematode while she watched.
In another sample, there were many bacteria inside an amoeba. “The amoeba started growing,” Zavala said. “Then it burst. The bacteria overcame the amoeba and took control.”
To take the CEU quiz for this article, CLICK HERE.
References
Agriculture and Agri-Food Canada, Resource management, indicators: Soil organic matter.
Chinook Applied Research Association Soil Health Lab Protocol for Soil Sampling.
Chinook Applied Research, soil health reports.
Cornell Soil Health Lab, Comprehensive Assessment of Soil Health, manual. (This manual includes a detailed explanation of data scoring, as well as detailed descriptions of each measure and suggestions for improving soil quality.)
Saskatchewan Soil Health Assessment Protocol, Phase II, Final Report.
Standing Senate Committee on Agriculture and Forestry. Critical Ground: Why Soil is Essential to Canada’s Economic, Environmental, Human and Social Health.