Long-term monitoring of agricultural and environmental conditions and practices has been an important function of government agencies. It has been my experience in recent years that a lot of important monitoring functions have been reduced in scope or discontinued.
In this column, I’ll describe a few examples of good monitoring and show the importance of the function. I’ll also talk about some monitoring that was done in the past but is no longer available. In some cases, measurement may be happening but accessing the data is a nightmare.
Read Also
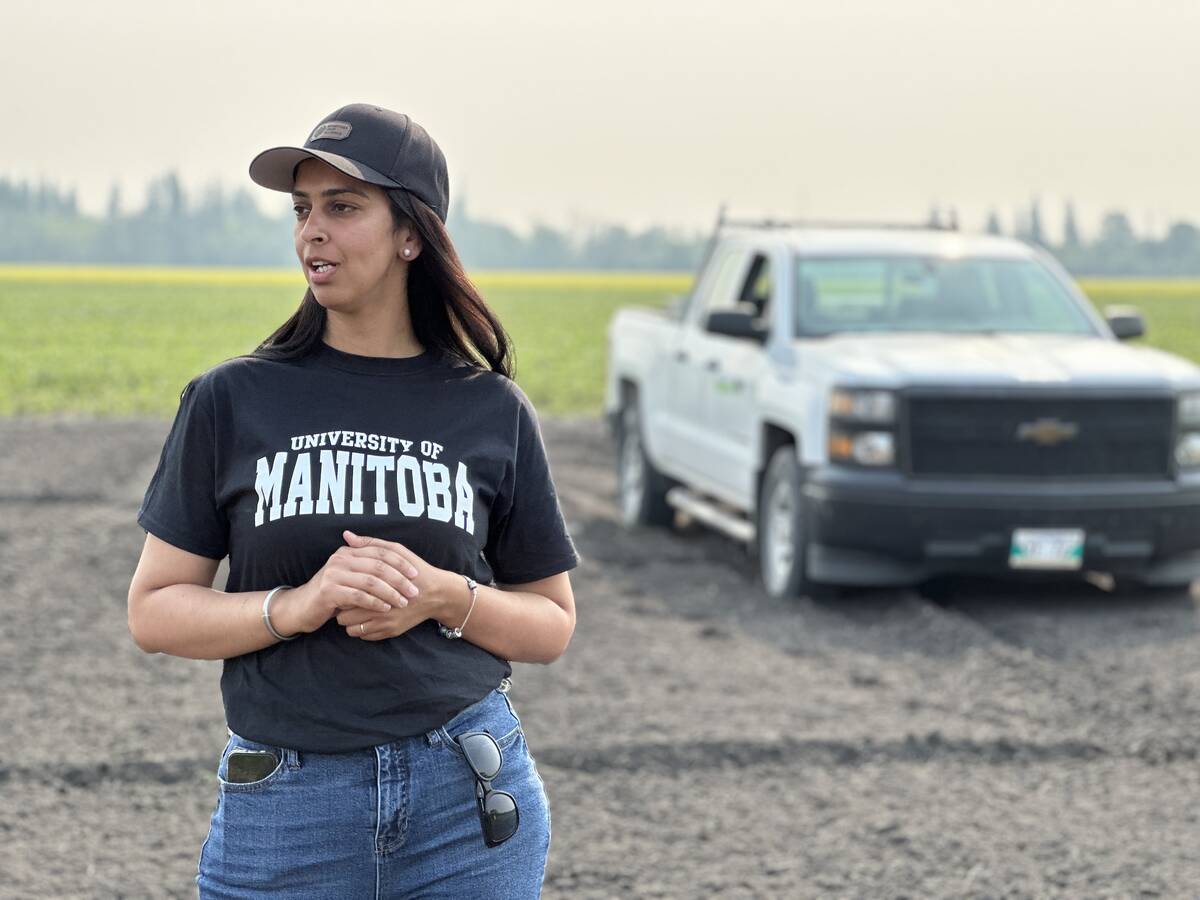
Corn research looks for Manitoba-based weed control
Manitoba corn growers rely on U.S. or Ontario weed control recommendations. University of Manitoba researchers are developing weed control advice with Manitoba field conditions in mind.
Groundwater observation well data
Knowing the height of the water table over time is important because many farm folks rely on groundwater for domestic and livestock use.
The drought of the 1930s spawned the best and most comprehensive water well survey ever done in the three Prairie provinces. The survey was done in 1935 and individual RM reports (Grey Books) were available the next year. Today it would take longer than that to form the committee to decide if it should be done! Those who have a copy of my book, Henry’s Handbook of Soils and Water can check out page 152 for more information.
The worry at that time was that shallow dug and bored wells were going dry, and the feds wanted to get a better handle on the problem. In 1935 there were many, many populated farms so the density of data is high. For shallow wells, the level at that time represents a low point. We now know that water table fluctuations can be as much as eight feet over time.
Long-term groundwater observation
All three Prairie provinces have long-term observation wells. The Saskatchewan Network was sited based on locations that would reflect how Mother Nature was operating without the confounding effect of groundwater wells and pumping. The network was established in the 1960s by Bill Meneley (1933 – 2000) who was with the Saskatchewan Research Council at the time. Groundwater work, including the well data, is now at the Water Security Agency at Moose Jaw and all data can be obtained at online on the Observation Well Network page on the Water Security Agency website.
The chart below shows a continuous water level record for a 35-foot well near Melfort, Sask. Regular readers will recognize that this is an updated version from an article in 2016.

There is a continuous record of the water level from 1968 to 2018. I interpret the slow but continuous water level drop from 1975 to 2005 as a 30-year net cumulative drought with slight upticks in 1985 and 1995. We still grew crops in those years but most years the next rain was needed soon.
The big swing in 2005 was driven by the huge snowmelt that year. The leveling off in 2011 means that the excess water coming in could dissipate, likely by causing soil salinity in the area.
I recently received a communication from former student Majorie Mann. She reminded me: “I recall a speech by Tim Ball, formerly meteorologist writing for Country Guide, predicting at the peak of the 2002 drought that given sun spot science we were in for a 15- to 20-year wet cycle beginning in 2005 and he has been spot on.”
Those of you that remember Tim Ball from talks at farm meetings can learn more at drtimball.com. Tim was a professor of climate science at the University of Winnipeg, and well known for dealing with climate facts. He spent much time studying the detailed weather records kept by the Hudson Bay Company and could quote chapter and verse to show that weather some global warmers think is “new” all happened hundreds of years ago.
Surface water quality monitoring
Information about water flows of rivers and streams and lake water levels is readily available with a Google search of water survey of Canada real-time hydrometric data.
But, information on water chemistry and quality is a different matter. In decades gone by the federal government, provincial governments and Prairie Provinces Water Board had an excellent program of sampling rivers etc. and the results were published in annual data books. The data included the major minerals and in some cases herbicides as well. I still have a shelf full of those books but they are now decades old and more recent data is not available.
The records from the three rivers that become the South Saskatchewan at the Alberta/Saskatchewan border had very good records showing that the phosphorus input had actually declined over many years. The reason was that Calgary and Lethbridge installed tertiary sewage treatment that removed the major source of phosphorus.
Some measurements are still being made but public access to data is almost nil. How can we know what effect mankind is having on waterways if there is no consistent monitoring? In today’s world it should all be accessible with a few mouse clicks.
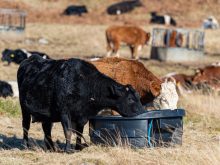
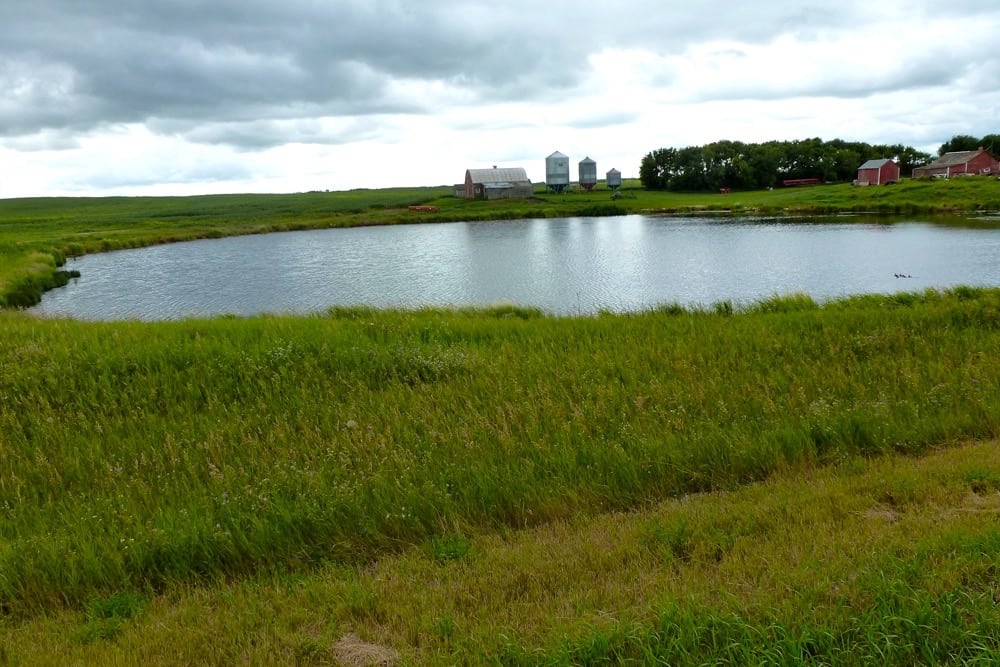
A simple example: Slough water
The table below shows data from a 12-year monitoring of salt content of a slough next to my farm yard on NW-22-32-3-W3, near Dundurn, Sask. The EC (Electrical Conductivity) is a measure of the electric current that passes through the water. The more salts, the higher the EC. EC for these waters is very close to the TDS (total dissolved solids) in ppm.

At the turn of the century that slough was dry and hay was cut. The cumulative net drought from 1975 to 2004 had lowered water tables and the water pressure in deeper aquifers that cause much of our soil salinity. The big snow of 2005 filled the slough and in June 2006 the water quality was fine for cows and could be used in some irrigation scenarios.
The continuous wet years actually made the water more salty. The salt ring around the slough and groundwater discharge would be the reason for higher salt with higher water level. For 2013 to 2015 the readings were in the 2,500 to 3,500 range.
The droughts of the past two years have brought big changes even over short time periods. In 2018 the water has gone from 3,750 on May 28 to 6,650 on July 30. The only decent rains in that time period were 0.75 inches on July 1 and 0.85 inches on July 4, both with little runoff. There have also been many days of 30 C temperatures and winds to suck up water.
Monitoring is really important and anyone with cows on pasture should be doing that monitoring or hiring it done.
Monitoring is often seen as an expensive exercise only good for academics. If we do not keep track of changes over time, how can we make proper decisions? In today’s digital world “big data: can do this but all the numbers gathered must be interpreted and placed in context to be useful in decision making.