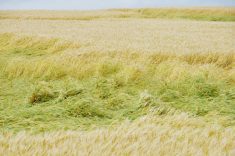
If each plant is in competition with its neighbours, competing for soil, water, nutrients and light, then the goal of seeding should be to achieve an optimum plant density (OPD) that will result in efficient use of all these resources.
Optimal plant densities depend on crop type, the intended end use for the crop, the region and the growing conditions. Canola is a flexible crop and can achieve high yields with a range of plant populations from five to 17 plants/ ft2. Very low canola plant populations often result in reduced yield, delayed maturity, increased lodging and increased dockage. Flax, also a flexible crop, can achieve high yields with plant populations from 26 to 50 plants/ft2. Under drought conditions, the low flax plant population will result in higher yields but under good conditions, a population of 30 to 40 ft2 will be beneficial, while under irrigation aim for the higher plant population. Achieving OPD for flax may result in higher crop yields, better weed competition, earlier maturity and fewer diseases.
Read Also

Is the technology in our vehicles a help or a hindrance?
Not only does new tech allow people to operate vehicles and farm machinery with fewer skills, it also creates more problems for vehicle users when those systems fail, Scott Garvey writes.
Cereals intended for silage, greenfeed or grazing often use higher target densities than grain crops. Similarly, cereals grown as cover crops with forages are seeded at lower plant densities than what is used normally for grain production. Based on research, the OPD for winter wheat is 29 plants/ft2 in spring (with a mortality of 35 per cent). Malting barley OPD on dry-land is 18 to 20 plants/ft2, while on irrigation it is 25 plants/ft2.
Traditionally farmers, and many still do, use bushels per acre as seeding rates. The problem with using bu./ac. is that there is no consideration for seed size, weight and seedling survival. Seed lots of the same variety will vary from field to field and from year to year (Table 1).
Different varieties can vary as much as 100 per cent or more in seed size and weight. The same bu./ ac. or lb./ac. will not give you the same plant population each year.
The seeding rate required to obtain an OPD will vary depending on:
1. The seeding environment, including the location and potential for drought, seedbed firmness, soil moisture and temperature; growing season length; soil type, texture, pH, surface residue and tillage; depth of seeding, fertilizer placement; crop intended end-use; and weed, insect and disease pressure. Consider these factors when determining whether to go with the low or high end of the range of seeding rates.
2. The seed itself. Seed size or 1000 KWT, per cent germination and vigour all play a role in refining seeding rates further.
Germination is expressed as a percentage; an 85 per cent germination rate indicates that 85 out of 100 seeds germinated. There is no sensitivity range; it is a yes/no assessment. Because the standard germination test is conducted in the lab under optimum conditions for seed germination, standard germination values generally overestimate actual field emergence.
Vigour is a more sensitive index of seed quality. Seed vigour is defined the ability of seed to germinate, emerge and produce a good crop under a wide range of environmental conditions. Since there are no standard vigour tests, we use seedling mortality as an estimate. Seedling mortality can vary greatly depending upon the quality of the seed and seedbed conditions at and following seeding. Mortality is an estimate based on plant counts done over a number of years. In cereals, a commonly used value is three to five per cent but this can range from one all the way to 50 per cent mortality. Canola can range from 20 to 80 per cent and flax 20 to 40 per cent.
The following will increase seed vigour:
Choose seed lots with high 1000 KWT. Larger seed has stored nutrients than smaller seed.
Choose seed harvested at physiological maturity. Seed harvested prematurely will have less vigour than mature seed.
Choose seed with no evidence of physical injury from harvest and/or transport.
Choose seed that has been stored properly and for short periods of time.
Choose seed harvested from field with good nutrient levels.
In a nutshell, germination is akin to whether or not you get out of bed each morning, vigour would describe the energy levels at which you rise to meet the day.
Considering these factors when selecting a seeding rate will result in a plant density that optimizes plant health and yield potential.
The effect of higher seeding rates on final crop yield may be less important than seeding rate affects on other factors such as weed management, early maturity, uniform maturity, crop quality, increased photosynthesis per acre and increased water use efficiency. Agri-coach Kelly Montgomery, who operates Full Circle Consulting out of Smoky Lake, Alta., says, “Switching my clients from bushels per acre to OPD has helped to take some of the guess work out of determining seeding rates. For each crop, we find out the germ, vigour and TKW so we know the quality of seed that we are planting. OPD ensures that we get a more consistent stand and this helps season long with weed control issues, diseases pressures and overall yield.”
Once we start using OPD to determine our seeding rates, what is the next step? Well Loraine Bailey, my fellow senior agri-coach, throws out this thought, “I understand OPD seeding rates, depend largely on soil type, salts, water and nutrient holding capacities, plant available water, slope and elevation. I will argue that we will not achieve optimum fertilizer use and yields until we are able to use variable rate technology (VRT) to manage seed depth and rates over the landscape, in fact make optimum use of available soil moisture. This is not to say that we will not get positive and economic results from VRT fertilizer use, but we will not achieve the genetic production potential of our crops. VRT-managed seeding depth and rate should precede VRT nutrient input.”
That will take some work on the seeder manufactures part but I’m sure its coming. Meanwhile, do your crop a favour and use OPD when choosing a seeding rate.
PhilThomasisasenioragri-coachforAgri- TrendAgrology
———
2
Table 1. 1000 KWT difference between lots, years and varieties
Crop
Wheat
Superb
Barrie
MacKenzie
Barley
Conlon
Newdale
Trey
Oats
Furlong
Ronald
Assiniboia
Flax
2005
# samples Largest Smallest # samples Largest Smallest
Da Flax ta courtesy of agri-coach Ron Curtis who operators Ag Soilutions at Neepawa, Man.
6
8
7
4
3
2
8
45.2
44.8
35.5
59.0
55.0
40.8
42.3
6.5
37.8
33.0
33.4
48.4
47.3
32.2
34.7
5.0
2006
3
10
2
9
2
2
2
2
1
5
39.6
38.0
36.9
51.6
46.8
54.9
49.6
43.7
46.9
6.6
34.0
27.5
32.5
40.1
45.7
54.8
48.8
35.4
5.8
2007
# samples
3
5
1
2
2
2
3
1
Largest Smallest
44.8
36.4
31.8
50.0
48.4
45.9
38.2
6.2
37.4
29.2
47.8
47.9
43.1
35.6
———
Calculating Seeding Rates
Desired Plant Population
Wheat
-Hard Red
-CPS
-Durum
-Extra
Strong
-Soft White
Barley 2row Barley 6row
Oats
Fall Rye
Canola Flax
Pea
Bean
Fababean Lentil
Chick Pea Soybean
Buckwheat Safflower
Sunflower confection
/m2
250 250
210
210
210 210
210 250
250 73 -178
260 -450 75
25 45
105 -147 12 (10 -14)
33 -44
50 150
50
4.5
/ ft2 (range)
24 (16 -30) 24 (18 -30)
20 (16 -24)
22 (20 -24)
20 (18 -25) 22 (16 -30)
22 (16 -30) 24 (16 -30)
24 (16 -25) 7 -17
26 -50 7 (7 -9)
2.4 (2.2 -2.6) 200 -350
4.3 (4.0 -4.3) 350 -425
3 -4
5 14
4.8
0.4
4. Estimate the seedling survival rate = Germination (%) minus seedling mortality (%) = 95% germination minus 5% seedling mortality = 90% or 0.90
Formula:
Seeding rate (lb./ac.) = desired plant population/ft2 x 1000 KWT (g)/ seedling survival rate/10
Examples:
Wheat seeding rate = 24 plants/ft x 35 g 0.90 10 = 93 lb./ac.
Pea seeding rate = 7 plants/ft x 225 g 0.90 10 = 175 lb./ac.
Canola seeding rate = 7 plants/ft x 4 g 0.50 10 = 5.6 lb./ac.
Flax seedling rate = 35 plants/ ft x 6 g 0.70 10 = 30 lb./ac.
1000 KWT (grams)
31 -38 39 -50
41 -45
40 -44
34 -36 40 -50
30 -45 30 -45
30 -35 3 -6
5 -7 125 -300
30 -80
200 -490 100 -200
30 35
175
Seeds/pound (average)
12,000 -14,600 10,800 -12,000
10,000 -11,000
10,000 -11,000
12,600 -14,200 9,000 -11,000
10,000 -15,000 10,000 -15,000
13,000 -15,000 113,000 -151,000
75,700 1,500 -3,600
1,300 -2,300 1,000 -1,300
5,600 -15,000 930 -2,300
2,300 -4,500 15,100
12,600
2,600