
It is no surprise to readers that this year’s freeze-up soil moisture map required a lot of red ink to print. In the Allan Hills, where my Dundurn farm is located, folks can drive combines with a full tank of grain through sloughs that needed a canoe to cross a few years ago. You do not need me to tell you that, so I will concentrate on providing some calculations of yield versus moisture to help you avoid red ink on the farm balance sheet in 2022.
Making the 2021 map
Read Also
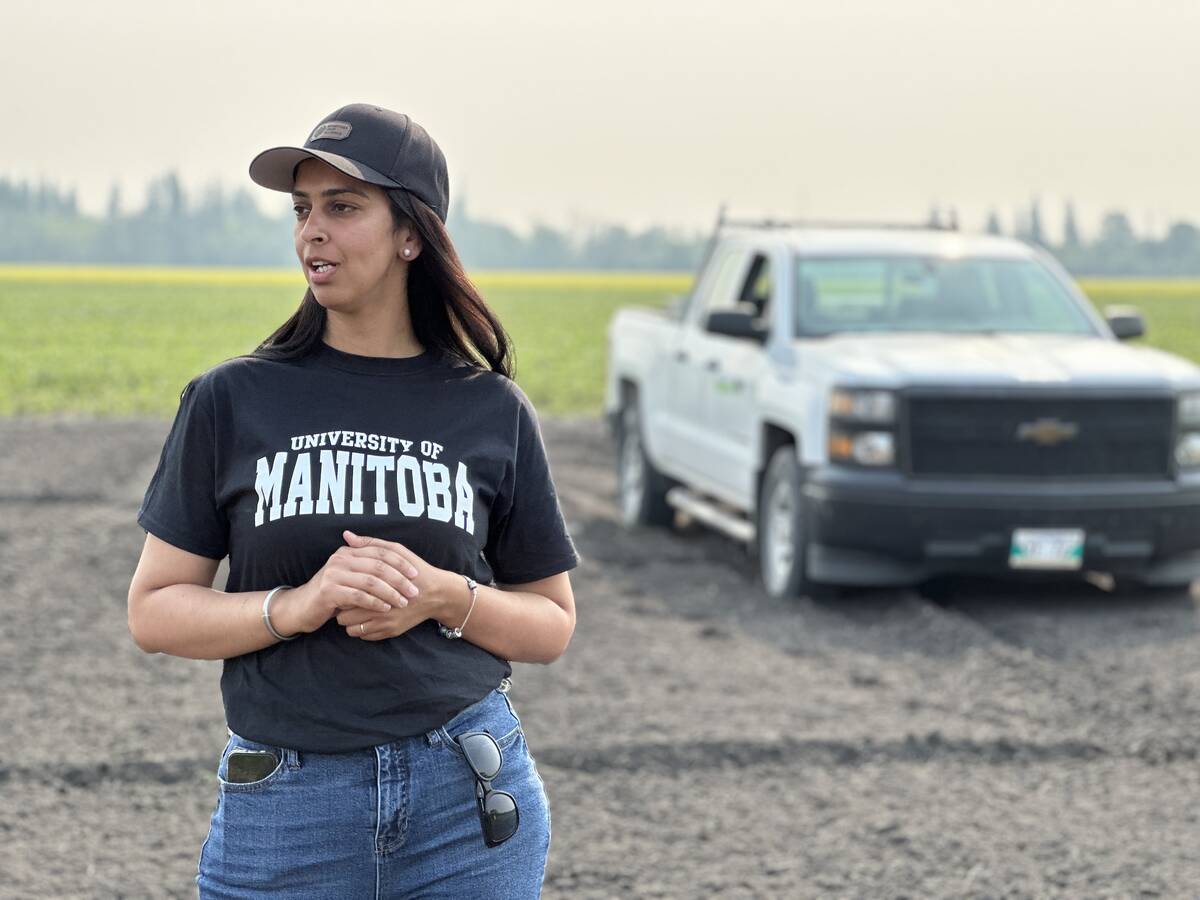
Corn research looks for Manitoba-based weed control
Manitoba corn growers rely on U.S. or Ontario weed control recommendations. University of Manitoba researchers are developing weed control advice with Manitoba field conditions in mind.
The map is based on rainfall data for 2021, with emphasis on rain that came after the 2021 crop quit using water. This year was a bit of a challenge because of the heat and second growth of crops, particularly canola.
The Alberta weather data website is a great source of rainfall data. There is a high density of stations, and it is easy to select as many as seven stations at a time and generate a graph of daily precipitation on a cumulative basis.
Saskatchewan does not have a weather station network, but Sask Ag does have 189 crop reporters who keep track of rain and forward data to Moose Jaw. They then prepare weekly rainfall maps that are of great value in tracking soil moisture.
Manitoba also has many weather stations, and the rain data can be easily accessed daily for all of the stations. Manitoba also has soil moisture maps based on a network of permanent soil moisture sensors at five, 20, 50 and 100 centimetres. Some individual sites show much more soil moisture than I have mapped.
The 2021 map
The recharge period for fall soil moisture is usually from about mid-August to October 31. Many areas (including my Dundurn farm) did have three or more inches of rain in mid- to late August. But the second growth, particularly canola, sucked that all up.
The big issue this year was the heat and a total lack of rain in September for almost all areas in Saskatchewan, Manitoba and eastern Alberta.
It is no surprise that this year’s map has a lot of red and yellow ink. The Moist category area (green) in Alberta includes some non-ag land at higher elevations. The small green area of Regina/Moose Jaw/Indian Head in Saskatchewan recognizes the much higher total season rain in parts of southeast Saskatchewan. Local areas in southeast Saskatchewan may also have more soil moisture than mapped.
The green area in southeast Manitoba is based on significant rain in mid- to late October in that area. I did map red in the Interlake area of Manitoba. That area is bounded by two large lakes, so it is usually well watered. However, the several rain stations in the area showed that was not the case this year. It is with some concern that I use red ink for Manitoba. If I am wrong, I am sure readers will correct me.
What about 2022?
I have no idea what rain might be like in 2022 — and have little faith in those that predict the rain.
What I do know is the soil reserve we had become accustomed to in the past decade is just not there. To plan for 2022, cropping realistic yield goals must be set.
Yield goals for 2022
There is little point in planning for a 60-bushel yield just because you have done it in previous years. Those with Henry’s Handbook can check out Chapter 7 and, particularly, pages 114-118. The tables there show yield equations for wheat, barley and canola for various soil zones and levels of soil water plus rain.
In those tables, we stated, “The equations apply only up to the genetic limit for wheat, barley and canola.” At the time they were printed, the higher yields (wheat at 69, barley at 104 and canola at 52 bushels per acre) were considered a pipe dream by some. I knew the data to be true as we had achieved such yields where we could vary water and nitrogen at the same time.
Especially for hybrid canola, the yields from those equations are now too low and the coefficients need adjusting. I know that for a fact because several years ago I spent a couple of days on a combine going 1.6 miles per hour and putting 70 bushels per acre of canola in the tank.
But the principles are still sound. Crop water use is a good capitalist system — the more water you have the less you need. An inch of water goes further in the cooler, grey black and black soil zones than in the warmer, brown soil zone. Also, an inch of water goes further in a wet year if that year is also cool. In a dry, hot year like 2021, an inch of water was gone back to the air in a flash.
Table 1 (below) shows yields in relation to water use. Not perfect, but a good first approximation to help plan crop inputs for 2022. The canola yields are definitely low for current hybrid varieties.

The yields in Table 1 will provide growers and agronomists with a framework to relate to. I have used my 26 years of crop yield, rain and soil moisture at the Dundurn farm to check out the yield equations. For the most part, the calculated and actual were within a few bushels per acre. The big error was 2010 with 14 inches of rain from May through July and a big fusarium head blight problem. The calculated yields were low in years when we knew the water table was providing self-irrigation from below and the equations do not take that into account.
Some growers may have very good yield and May, June and July rain records, and can do some calculations based on their own data. That would be the best.
The “Rain 10 inches” column drives home the statement I have often made — 10 inches of rain makes us all good farmers. Here’s to 10 inches of rain to all of you for the 2022 crop.
Climate change and crop yields
If we listen to the Intergovernmental Panel on Climate Change (IPCC) and Environment and Climate Change Canada (ECCC), we are going to have more droughts and more heat and must adapt to what they project (not predict) to be the new normal. The projections are all based on complicated mathematical models, not facts.
The big heat and drought of 2021 was touted as being more evidence of the effects of climate change. However, the 2021 experience is weather not climate. I repeat — weather is the month-to-month and year-to-year variations in temperature and precipitation we experience. Climate is the 30-year average.
Below is a graph showing the 30-year moving average precipitation for Swift Current, Sask. As plotted, 1915 is the average of 1886-1915 and 2020 is the average of 1991-2020.

The early years of farming were the glory years. The Palliser Triangle was taken to be not fit for farming based on 1858-60 observations. When my grandfather Jerome Henry arrived in 1906, he and thousands of others harvested good yields of wheat. Rain follows the plough was how it was all rationalized at that time. Hogwash. Mother Nature was just doing her thing. Climate change was happening as it always had and recent climate change has been much to our advantage.
From 1940-90, the average rain in the main period of crop growth was six inches. Here, 1990-2020 have been the glory years again. On a climate basis, the rainfall in the critical months has increased and the temperature has decreased, resulting in an increase in water use efficiency. Our farming methods have complemented the yields, but without the increased rainfall we would not fare as well.
Not long ago, canola was a black soil zone crop. Swift Current is in the brown soil zone. The average canola yield in the RM of Swift Current No. 137 for 2010-20 was 38 bushels per acre (Sask Ag website).
Some final words
In 1991 at the University of Saskatchewan, we published a wall map of the “Soil Climatic Zones of Southern Saskatchewan.” The zones established were named dry brown, brown, dark brown, moist dark brown, black, moist black and grey. The objective was to use those zones to increase the accuracy of nitrogen fertilizer recommendations. By that time, the water-nitrogen interaction was well documented. The back of that map explained how it was all done and showed the average annual precipitation and temperature data for the 192 Environment and Climate (now ECCC) stations in Saskatchewan — most of them in the ag area.
Having gone through the exercise of putting this piece together, I have concluded it is past due the time to do an update of climate data.
By now, there should be better and more up-to-date data, but that is just not the case — particularly for precipitation. Over the past decade, I have been slowly assembling temperature data and it clearly shows in the critical growing months temperatures are lower. September temperature is higher, so that extends the frost-free period but not the prime growing period. We now have enough stations to be credible.
Access to precipitation data has taken a giant step backward.

Directly above this paragraph is a screen capture of a graph from the ECCC website. AHCCD is an abbreviation for Adjusted and Homogenized Canadian Climate Data.
The climate crisis is not that we will fry out — it is a crisis in availability of actual climate data, especially for the critical precipitation variable.