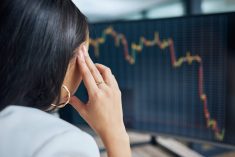

According to a Bloomberg article, average retail investors lost 30 per cent in 2022, significantly underperforming the 17 per cent loss of the S&P 500.
While this is U.S. data, it seems unlikely that Canadian investors fared much better given the excitement around technology and disdain for energy. This was by no means an anomalous situation.
In 2021, Dalbar, a research organization, reported average investors underperformed the S&P 500 by 10 percentage points, with a return of 18.4 per cent versus 28.7 per cent, respectively. In a long-term study encompassing two decades from 1993 to 2013, the S&P 500 averaged 9.2 per cent annual gains, whereas the average investor earned a meagre five per cent.
Read Also

War hits farm equipment makers’ share prices
There could be a very rocky road ahead for the U.S. economy, and valuations of U.S.-based corporations, such as major equipment makers, could continue to take a beating, Scott Garvey writes.
Complicating matters, I have read and intuitively believe that smartphones hurt performance as they motivate quick rather than thoughtful decisions, feeding the trading rather than investing mentality.
Whether invested directly in stocks or using products like exchange-traded funds (ETFs) or mutual funds, the data is rather astounding as it shows how poorly the average investor performs relative to the market.
Even professionally run mutual funds generally underperform. The reason, I believe, is simple: the term investor is used loosely, as most market participants are traders or speculators — my broken record.
My own performance and that of the Titanium-Strength Portfolio should by now have proven that being a true investor is more lucrative. We don’t have to behave like the average person!
A key step is to accurately measure our own performance and benchmark it. I annually record portfolio performance benchmarked to the S&P 500 and TSX.
Most internet brokerage sites provide portfolio performance data but I still calculate it by hand, believing there is psychological value in coming to grips with my own performance, good or bad. I then integrate the annual performance into an Excel grid that calculates my compound annual growth rate (CAGR) compared with the average of two indexes.
How to calculate annual returns
Calculating annual returns is simple if there are minimal fund flows in or out of the account. If an account starts the year with $10,000 and ends with $11,000, the return is 10 per cent.
However, we must also consider fund flows. If an account starts the year with $10,000, has $1,000 added on July 1 and ends the year with $12,000, what is the return rate? The gain is easy to calculate at $1,000 but what is the denominator in the percentage calculation?
We had $10,000 working for us for 12 months and $1,000 for six months. The average funds working for us was, therefore, ($10,000 x 12 + $1000 x 6)/12, which equals $10,500. The $1,000 gain is then divided by $10,500, for a 9.5 per cent gain. If there are a lot of flows in and out, this calculation gets difficult and that’s not a good sign.
Some people may suggest that cash in the account should not be included in the return calculation because it’s not money working in the market. I disagree with that position because cash is a decision made when we fear a market downturn.
I don’t play market timing games as they are usually unproductive, reducing returns. Rarely do I have more than a few per cent cash in any account, and I get excited when enough dividends accumulate to buy more stock. Accumulated dividends in our tax-free savings accounts (TFSAs) equalled our contribution limit this year. Rather than invest an additional $13,000, I got to invest about $26,000 in new stock. Cool!
By the way, I didn’t make any changes to either of our TFSAs between early January 2022 and early January 2023, when new funds were added. The accounts were up marginally in a year that saw average investors lose 30 per cent. Constant trading creates work and reduces returns. Stability pays off.
To take this annual return calculation approach, we must drop one of the long-held market misperceptions — that we must sell to profit.
Many will take the accumulation of the gains and losses crystallized in a year to calculate returns. If that produces a gain but the stocks held are down and the whole portfolio is down, are we simply making ourselves feel good while losing money? Individual trades are only meaningful in how they contribute to portfolio growth.
To illustrate, I still own shares of Bank of Nova Scotia purchased in my RRSP 30 years ago, for a split adjusted price (they split twice turning 100 shares into 400) of $5.59 per share. They are currently $68.20 and have paid about a five per cent dividend on the current value each year.
I still like the stock and recently added 100 more to the RRSP at $65.99 and 50 to the TFSA at $67.44. Can anyone rationally explain to me how selling the original shares creates a profit, then buying them all back plus more makes sense?