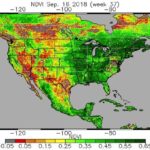
Statistics Canada’s model-based report is based in part on data from sensors on the U.S. National Oceanic and Atmospheric Administration (NOAA) series of satellites. The Normalized Difference Vegetation Index (NDVI), shown here for Sept. 16 over an NOAA satellite map of North America, is used to gauge surface vegetation content. (OSPO.noaa.gov)

Canola, wheat crop size hiked in StatsCan’s view from space

CNS Canada — Statistics Canada raised its production estimates for most crops across Western Canada in its latest report released Wednesday. Unlike traditional StatsCan reports using information gathered from phone surveys, the model-based report was based in part on coarse-resolution satellite imagery collected during the month of August. The model-based report has only been in […] Read more

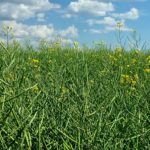
Canola south of Ethelton, Sask. on Aug. 3, 2017. (Dave Bedard photo)

Prairie crop tour sees slightly bigger wheat, canola yields

Saskatoon | Reuters — Canadian farmers were on track to reap slightly larger wheat and canola yields, despite dry conditions and a wide discrepancy in growth rates, a crop tour estimated on Thursday. The inaugural Grain World crop tour, organized by FarmLink Marketing Solutions, toured the Prairie provinces on Tuesday and Wednesday. Moisture conditions vary […] Read more


(Dave Bedard photo)

Canadian canola area likely above earlier projection

CNS Canada — Canadian farmers likely seeded more canola in 2018 than initial expectations, but industry participants generally expect to see only minor adjustments when Statistics Canada releases its latest acreage estimates on Friday. “Our idea is that the canola seeded area number is higher than initially reported,” said Jon Driedger of FarmLink Marketing Solutions. […] Read more