
There is increasing concern with below-normal mountain snowpack and potential for limited irrigation water availability in 2024. Snowpack in mid-February was about 50 to 75 per cent of normal at most of the snow pillow monitoring sites in the Rocky Mountains of northern Montana and southern Alberta (visit the Alberta River Basins web page, then click on “Snow pillow” to view monitoring sites).
In a normal year, most irrigation districts in Alberta provide about 450 mm (18 inches) of water for each acre with water rights. But with looming drought concerns, some irrigation districts are advising their water users to be prepared for limited irrigation water availability this summer. Farmers should consider developing alternate irrigation management plans to decide how they might reallocate limited water to their various crops and fields.
What can farmers do to plan and prepare?
Start by reviewing key information about your operation. List the crops to be grown this year and the total water requirements for each crop, estimate the amount of stored soil water in each field going into spring, and speculate on growing season precipitation for each crop (shorter season versus longer season crops).

Then, using this information, develop a spreadsheet with different irrigation water scenarios to consider options to relocate limited water.
- What is the approximate water requirement for each crop to be growing on the fam in 2024? Table 1 lists a number of crops with approximate total water use to assist with addressing this question.
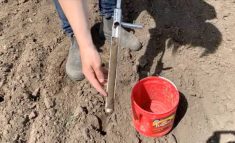
- How much plant-available soil moisture is stored in each field going into spring? Often in the top 60 cm (24 inches) of soil, there will be 50 to 75 mm (two to three inches) of stored water remaining from the previous season. Amounts may be higher in clay loam or clay soils, but lower in sandy loam or loamy sand soils. When field conditions allow, check your fields to estimate plant available soil water going into spring.
- What is the approximate precipitation received during the growing season? This is obviously quite variable from year to year. Typically, it would be in the range of 150-175 mm (six to seven inches). But consider using both average precipitation and the possibility of a dry season with only 60 per cent of the average precipitation in your planning.
Develop a spreadsheet
Using your information, develop a spreadsheet for your farm fields. Table 2 shows an example of a farm with 20 fields, with five crops, including silage corn, spring wheat, potato, canola and dry bean.

For your farm, list all fields, using legal land locations and/or field names, and the crop to be grown in each field. In my example, I assumed each field is pivot-irrigated, watering 133 acres. For each of your fields be sure to list the number of acres irrigated, to assist with calculating water requirements for the farm.
Next, list the estimated total water requirement for each crop, using information from Table 1, and adjust based on personal experience. Then, estimate stored soil moisture in the top 60 cm (24 inches) of soil for each field. Ideally, check the soil moisture conditions in each field in the spring as soon as the frost is out of the ground for an accurate estimate.
Next, estimate a reasonable growing season precipitation for each crop, keeping in mind the time of seeding to harvest. Also, use a scenario with only 60 per cent of average growing season precipitation to simulate a dry growing season.
Read Also

Corn research looks for Manitoba-based weed control
Manitoba corn growers rely on U.S. or Ontario weed control recommendations. University of Manitoba researchers are developing weed control advice with Manitoba field conditions in mind.
Use the spread sheet to calculate the estimated net irrigation water requirement — that is, total crop water requirement minus stored soil moisture and estimated precipitation. Irrigation systems are not 100 per cent efficient, so assume about 20 per cent loss of water to calculate an estimated gross crop water requirement. This is the approximate amount of water needed for optimum crop water use and to account for water losses. In my examples, to keep things simple, I assumed a 20 per cent loss and rounded to the nearest half inch to estimate the gross crop water requirement.
Then, in the spreadsheet, enter the irrigation water allotment from the irrigation district. Use several different amounts in your scenarios. In my examples, in Tables 2 and 3, I used 15 inches and then 12 inches for the water allotment.
Next, subtract the gross irrigation requirement from the irrigation water allotment. This resulting value shows if there is an irrigation water surplus or deficit per acre for the crop in that field. Multiply the surplus/deficit by the number of acres in the field to calculate the surplus/deficit in acre-inches. (An acre-inch is the amount of water needed to cover one acre with one inch of water, which is about 27,000 U.S. gallons.)
Table 2 has a simplified example of determining irrigation water balance on an irrigated farm with 20 fields, with five different irrigated crops, with lower-than-average growing season precipitation, to determine estimated net and gross irrigation water requirements.
In this scenario, the irrigation district allotment is 15 inches of water per acre for each field. With an irrigation water allotment of 15 inches of water per acre, the surplus or deficit in inches is determined for each crop in each field.
Then, based on the number of irrigated acres for each field, the water surplus or deficit in acre-inches is calculated. In this example, there is a deficit of 4,256 acre-inches of water. The silage corn and potato fields are in a water deficit, but the wheat and bean fields each have a surplus of water. Canola is close to water balance. The surplus from the wheat and bean fields can be transferred to the silage corn and potato fields. Reallocating water from the wheat and bean fields will not quite make up the full deficit but it is close. Irrigation water could be cut back on the lower-value wheat crop and transferred to the silage corn and potato fields, if necessary.

Table 3 provides another scenario for this farm, keeping all water inputs the same but with an irrigation district allocation of only 12 inches per acre. This scenario is much more challenging to manage. All crops, expect dry bean, are in a water deficit situation. Now, tougher decision-making processes come into play, such as:
- How much water could be cut back on the lower-value wheat crop and transferred to the silage corn, potato and canola fields?
- Could canola acres be reduced in favour of a lower-water use crop?
- Could wheat or bean acres be increased as they are lower-water using crops?
- Could the number of fields in potatoes or silage corn be reduced?
- What is the potential yield loss for each crop, for each inch of water deficit?
For your farm, develop and run different scenarios with different precipitation levels and irrigation water allotment amounts, and consider different crop plans. Then, more informed decisions can be made as to which crops to under-irrigate and where to reallocate water to other crops with a higher value or importance to the farm.

Consider the potential yield loss for each inch of water that is shorted. In this example, wheat would likely have a lower value and suffer the least yield loss by cutting back on irrigation versus other crops.
Managing irrigation water during the growing season
At the start of the growing season when the irrigation district has advised of the actual irrigation water allocation, enter this into the spreadsheet for each field. Modify the spreadsheet to add columns to enter each precipitation event and columns for each irrigation water application during the season, to keep a running total for each field. If the irrigation district adjusts the irrigation water allocation, adjust it in the spreadsheet to update your estimates of potential water surplus or deficit for each field.
To assist with tracking precipitation, have rain gauges set up at strategic locations across the farm. To track irrigation water amounts, have a rain gauge under each pivot to measure actual water applied.
Use the spreadsheet to carefully track precipitation and applied irrigation water. As the season progresses, hopefully tracking water amounts in the spreadsheet will assist with forecasting when and how to manage water in all fields on the farm, including when and where to reallocate water to different fields and crops. The spreadsheet could be very helpful for working with your irrigation district to show what you are doing and how you want to reallocate irrigation water.
Finally, do your best to keep soil moisture in all fields above 50 to 60 per cent of field capacity, in the top half of the effective root zone for each crop. I discussed irrigation management in two Grainews articles last year. For more information to assist with irrigation management, review the articles I wrote titled How to manage and schedule irrigation, Part 1 (April 18, 2023), and How to manage and schedule irrigation, Part 2 (May 9, 2023). Also, both Alberta Agriculture and Saskatchewan Agriculture have irrigation manuals on their websites which are excellent resources.
Final comments
If forecasts of limited irrigation water availability do occur this growing season, it would be wise to develop irrigation scenarios now and be prepared in spring to track your irrigation water during the growing season. This will allow you to make informed plans to reallocate irrigation water to ensure optimum crop production across the farm.
I hope the concerns of reduced irrigation water availability are minimal this year. But it is wise to have plans in place. Do your best to be prepared and informed.