
Annual returns from the U.S. stock market have averaged 9.4 per cent since 1900. Over these 119 years, inflation has run 2.9 per cent, so long-term after inflation returns have been 6.4 per cent.
Stocks exhibited significantly better real returns than bonds at 1.9 per cent, T-bills at 0.8 per cent and residential real estate at 0.3 per cent. Given the data, it is baffling that our North American culture has many believing that stocks will make you poor while your house will make you rich.
One dollar invested in U.S. stocks in 1900 would now be $44,663, in U.S. bonds would be $292, and in T-bills would be $76. This dramatic difference is the result of compounding and the “Rule of 72.” Inflation takes its toll, with after-inflation values being $1,521, $9.90 and $2.60.
Read Also

Is the technology in our vehicles a help or a hindrance?
Not only does new tech allow people to operate vehicles and farm machinery with fewer skills, it also creates more problems for vehicle users when those systems fail, Scott Garvey writes.
Since 1900, the U.S. stock market has been the second-best performing market in the world. First place goes to Australia with a 6.5 per cent real return rate, and third, surprisingly, to South Africa. These are followed by New Zealand, Denmark, Sweden, and in seventh place Canada at 5.4 per cent.
Most European countries didn’t fare well in this very long-term data, likely because of the two World Wars. Australia had the best housing market with 2.2 per cent annual after-inflation returns. This return severely lagged behind Canadian and U.S. stock returns.
Sorry, no such long-term data is available for farmland. However, I found a 50-year chart suggesting the inflation-adjusted value of U.S. farmland tripled between 1968 and 2018. This would put farmland roughly on par with bonds, but still well below stocks.
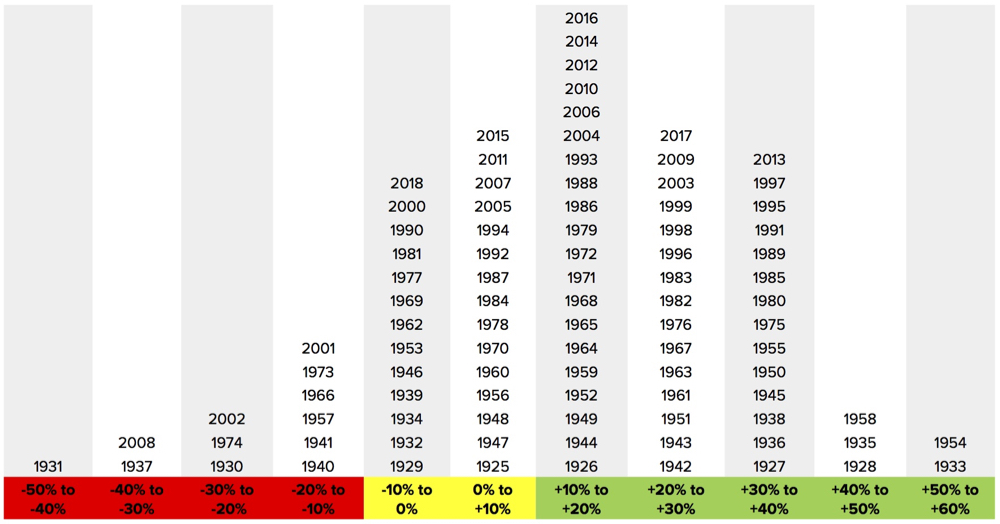
Having recently introduced the bell curve, I thought I would look at year-to-year volatility. The graphic shows annual U.S. annual average returns back to 1925. Each year is categorized by total market return and placed in columns within 10 percentage points. Since the average before-inflation return has been about 10 per cent, you would expect the greatest frequency of years in the zero to 10 per cent and 10 to 20 per cent ranges. However, there were more years in the 20 to 30 per cent and 30 to 40 per cent ranges than expected, skewing the bell curve to the positive side.
Why not stocks?
What keeps people away from stocks when they are clearly the best performing asset class? There are many reasons, including fear of a big down year. Let’s put this fear into logical perspective. As you can see in the graphic, there were only six years out of 94 with big losses of 20 per cent or greater. However, there were 34 years with big gains of 20 per cent or more, outnumbering big loss years by 5.7 times. If we tossed a dice and made a $1,000 bet that if it landed on 6, I would win, but if it landed on 1, 2,3,4 or 5 you would win, my guess is you would take that bet — and take me to the cleaners until the cows came home. The beauty of the stock market is you get those same odds again and again at the start of each year.
The odds I just relayed are based solely on big years. There were also significantly more years with small gains of zero to 20 per cent than with small losses of zero to negative 20 per cent by a factor of 35 to 19 — almost 2:1.
I don’t like gambling analogies like the one above applied to investing, and I think the press and financial industry do a great disservice when they use such terminology. True investing includes aspects of randomness and probabilities, like all aspects of life, but it isn’t gambling. Speculating, however, is synonymous with gambling.
Past performance isn’t assured going forward, but if a track record is sufficient in length, I believe it is the best indicator of future performance. Ten percent annual returns may not be sustainable but I am very confident stocks will continue as the best asset class.
How often does the worst year in 77 years come around? The most recent big bad year was the worst since 1931, and 2008 still dominates market psychology, keeping many from the benefits of stocks’ long-term dramatic outperformance. A small probability of a big bad year drives many from 6.4 per cent real annual returns to the lower performance of bonds or T-bills. That simply makes no sense to me.
The data cited in this column comes from Credit Suisse 2018 and 2019 annual year-books.