
In my last two articles, I discussed phosphorus cycling in soils and soil testing for phosphorus. In this article, I’ll focus on how to develop phosphorus fertilizer recommendations.
First, it’s important to remember that most soil testing labs report the phosphorus soil test as P, either in parts per million (p.p.m.) or in pounds per acre (lbs./ac.). Fertilizer recommendations are made using phosphate (P2O5) and recommendations are usually in lbs./ac. All phosphorus fertilizer is sold as phosphate: P2O5. To convert P to P2O5, multiply by 2.3. For example, to convert 20 lbs. of P per acre multiply by 2.3 to get 46 lbs. of P2O5 per acre. To make it a little more complicated, there is no P2O5 in P fertilizer. Our most common P fertilizer used is monoammonium phosphate with the chemical formula of NH4H2PO4. The phosphorus form in the fertilizer is PO4.
Next, it is important to have a good sense of how much phosphate is taken up by a crop and how much is exported from your fields each year. Table 1 shows the approximate amounts of phosphate (P2O5) uptake by various crops. To determine phosphate removal and export from your fields, use the Prairie Nutrient Removal Calculator, available online.
Read Also
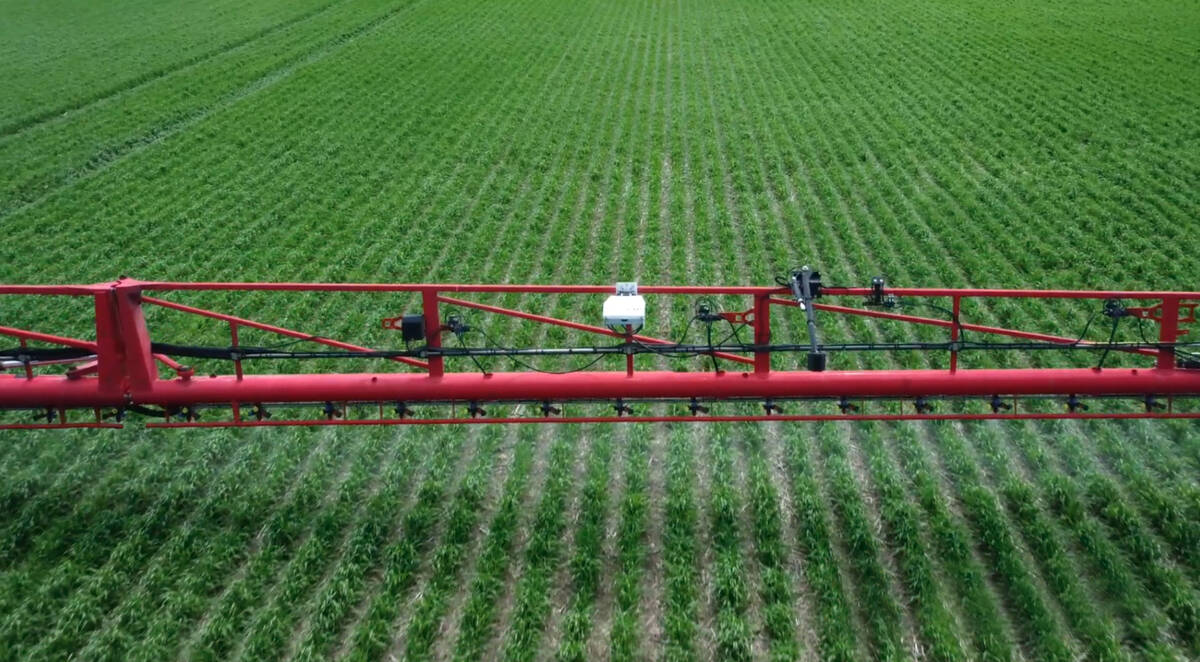
Croptimistic’s SWAT Cam maps one million acres in Western Canada
Croptimistic’s SWAT Cam has mapped more than one million acres, using sprayer-mounted cameras to generate crop and weed maps that support in-season analysis and future management decisions.

Soil test phosphorus
As mentioned in my previous article, Manitoba Agriculture recommends the Olsen method to determine soil P in that province. For Alberta and Saskatchewan, soil samples should be tested using the modified Kelowna method, as this is the method recommended by each province. Almost all soil test P calibration research in Alberta has been with the modified Kelowna since 1991.
Further, all soil test calibration work with phosphorus has been based on zero- to six-inch depth samples. So, always sure to sample the zero- to six-inch depth separately from deeper depth samples to accurately determine P fertilizer requirements.
If your agronomist is using other soil test P methods, such as the Bray method, it has not been calibrated to western Canadian soils and is not recommended for making P fertilizer recommendations in Western Canada. If the lab or agronomist you work with uses the Bray method or another uncalibrated method to make P recommendations for your farm, odds are the recommendations are from Ontario or the U.S., meaning you are probably not getting the best 4R phosphate fertilizer recommendations.
Phosphorus is either very low, low or medium-range in about 80 per cent of Prairie soils. In the past 10 to 15 years, many farmers have been applying P fertilizer at rates less than crop removal, resulting a slight decline in soil test P, which is a concern.

An important question farmers need to answer is how deficient is soil P in your fields? In Manitoba, using the Olsen method, if the soil test is 10 to 15 lbs. P acre, then P is low — and if higher than 40 lbs. P per acre, soil P is considered very high (Table 2). The modified Kelowna method has broader range; if the soil test is 20 to 40 lbs. P per acre, then P is low, and if higher than 80 lbs. P per acre, soil P is considered very high (Table 3).

Soil tests can give a good estimate of soil P levels but cannot predict with 100 per cent accuracy when crops will respond to added P fertilizer. The frequency of crop response is strongly influenced by environmental conditions, particularly soil temperature and moisture. For example, at research sites in Alberta, the observed response to P fertilizer, particularly with wheat, barley and canola, tended to be greater with wetter, cooler spring soil conditions versus warmer, drier conditions. Generally, farmers can expect greater crop response to P fertilizer in wetter or cooler spring conditions.
Soil pH effect on soil phosphorus
Some agronomists are concerned about the effect of soil pH on plant availability of soil P. Orthophosphate, the form of P taken up by plants, is highly reactive with certain soil elements. Generally, soil P is slightly more available to plants in a pH range of 6.0 to 7.8. At higher pH levels (>7.8), calcium (Ca) is more reactive with phosphate, creating forms that have slightly lower availability to plants. Magnesium (Mg) acts in the same manner, forming less-available magnesium phosphate compounds. In more acidic soils, aluminum (Al) and some other elements increase in solubility and will tie up soil P. This reaction limits the availability of inorganic P to plants when soil pH levels drop to less than 5.5. Generally, I am far more concerned about P tie-up at low soil pH than higher soil pH.

Phosphorus fertilizer recommendations
Phosphate fertilizer recommendations for various crops are provided on the web sites of Alberta, Saskatchewan and Manitoba departments of agriculture. In this article, I’ll refer to the Alberta Agriculture Agdex 542-3, titled “Phosphorus fertilizer application in crop production.”
Table 3, from the Alberta Agriculture Agdex, shows the example for phosphate fertilizer recommendations for wheat based on the modified Kelowna soil test P level by soil zone. Recommendations are adjusted for seed-bed soil moisture content. Table 4 provides an estimate of the probability of response of wheat to phosphate fertilizer, based on Alberta field research. To determine the recommended rate of phosphate, simply look at the soil test P level in Table 3 and match it with the soil zone of your farm.

For example, from Table 3, if you are growing wheat in the Thin Black soil zone and your soil test level is 35 lbs. P per acre, then the recommended phosphate rate would be 30, 35 or 40 lbs. P2O5 per acre, depending on if seedbed moisture conditions are drier, moist or wet, respectively. Normally, I would use the moist to wet values for the recommendation. Then, from Table 4, a farmer could expect a 90 per cent probability of at least a two-bushel-per-acre yield increase and expect a 70 per cent probability of a five-bushel-per-acre yield increase with wheat. This information is also available for barley and canola in the Alberta Agriculture Agdex.
Next, estimate your crop target yield and look up the expected crop P2O5 removal rate from the Prairie Nutrient Removal Calculator. If the removal rate of P2O5 is greater than the recommended fertilizer rate, consider applying the removal rate to maintain soil test P level in your fields.

Finally, for any fields that test very low or low for soil P, consider adding an additional 10 or 15 lbs. P2O5 per acre each year to help build soil P levels over the long term, keeping in mind your economic conditions.
Phosphate fertilizer considerations
Field research across the Prairies has shown placement of P fertilizer with, or banded near, the seed results in best yield response for most annual crops. Phosphate recommendations are typically based on P placement with or banded near the seed. Care is needed not to exceed the safe seed-placed rate for each crop grown. Table 6 shows general safe rates of seed-placed P using monoammonium phosphate (MAP) — for example, 11-51-0. Note that the recommended seed-placed safe rates vary slightly among provinces depending on field research over the years.

Some farmers purchase diammonium phosphate (DAP) — for example, 18-46-0 — in the U.S., due to proximity to the border and price. Phosphorus in DAP is less available on high-pH soils versus P in MAP. Alberta and Saskatchewan soils in the Brown and Dark Brown soil zones tend to have a higher pH, so MAP is a better fertilizer choice. Also, DAP has seed-placed P concerns, so not as much DAP can be safely placed with the seed.
Cereal crops grown on soils that are very low to medium in available P are most responsive to seed-placed phosphate at recommended rates. Crop response to seed-placed phosphate can be equal to or better than banding phosphate, except in drier spring conditions, when banded P can be better than seed-placed P.
For canola grown on soils very low to medium in available P, rates up to 15 to 25 lbs./ac. P205 can be seed-placed with a seedbed utilization of 10 per cent depending on seedbed moisture conditions. I prefer to use a more conservative rate of seed-placed phosphate to avoid germination injury. Higher P rates needed for canola should be split between seed-placed and side- or mid-row banding at the time of seeding or banding prior to seeding. Seed-placed or banded fertilizer P on soils high in soil test P, at rates up to 15 lbs./ac. of P205 may result in a small crop response 30 to 50 per cent of the time, depending on soil zone and environmental conditions.
Pulse crops tend to be less responsive to phosphate fertilizer, due to somewhat better efficiency to take up soil P. Alberta research suggests pea is most responsive to phosphate fertilizer when soil test P levels are less than 30 lbs. P per acre (modified Kelowna method). Above this level, there is a relatively low chance phosphate fertilizer will increase yield. When soil test P levels are medium to high, an annual maintenance application of phosphate fertilizer should be considered to meet crop requirements and replenish soil P that is removed.
Benefits of starter phosphate fertilizer
To get a crop off to a good start, having an adequate supply of P close to the seed during the first six weeks of growth is important. Most annual crops take up the majority of their P requirements in the first 40 days after emergence. Placement of P in or near the seed row has traditionally been the best method used for P fertilization across the Prairies, depending on seed safety concerns.
Effect of previous crop
Canola has a relatively high demand for soil P. It’s a non-mycorrhizal crop and uses different mechanisms to take up soil P, leaving plant-available soil P more depleted compared to cereal or pulse crops. As a result, cereal crops that follow canola tend to be more responsive to P fertilizer. I usually suggest adding an additional 10 lbs./ac. of phosphate over and above the phosphate fertilizer recommendation for cereals, when following a good-yielding canola crop.
To sum up: Prairie farmers spend over $1 billion annually on phosphate fertilizer. Hopefully, reviewing these three articles will assist with a better understanding of how soil P functions in soil, soil testing for P and then how to develop wise phosphate fertilizer recommendations.