
There are four key factors affecting our personal investment success — understanding market behaviour, security selection, portfolio construction and managing yourself. I will discuss two in this column and two in the next. Most discussion is around security selection, but the other factors are equally important.
Understanding market behaviour
The market often exhibits perplexing and counterintuitive behaviour. As an example, the S&P 500 rallied almost four per cent the first two days after Russia invaded Ukraine. This phenomenon can be partially explained by market participants anticipating a potential negative event. And when such an event occurs, the negatives are already “baked into the cake,” leading to a short-term rally.
Read Also
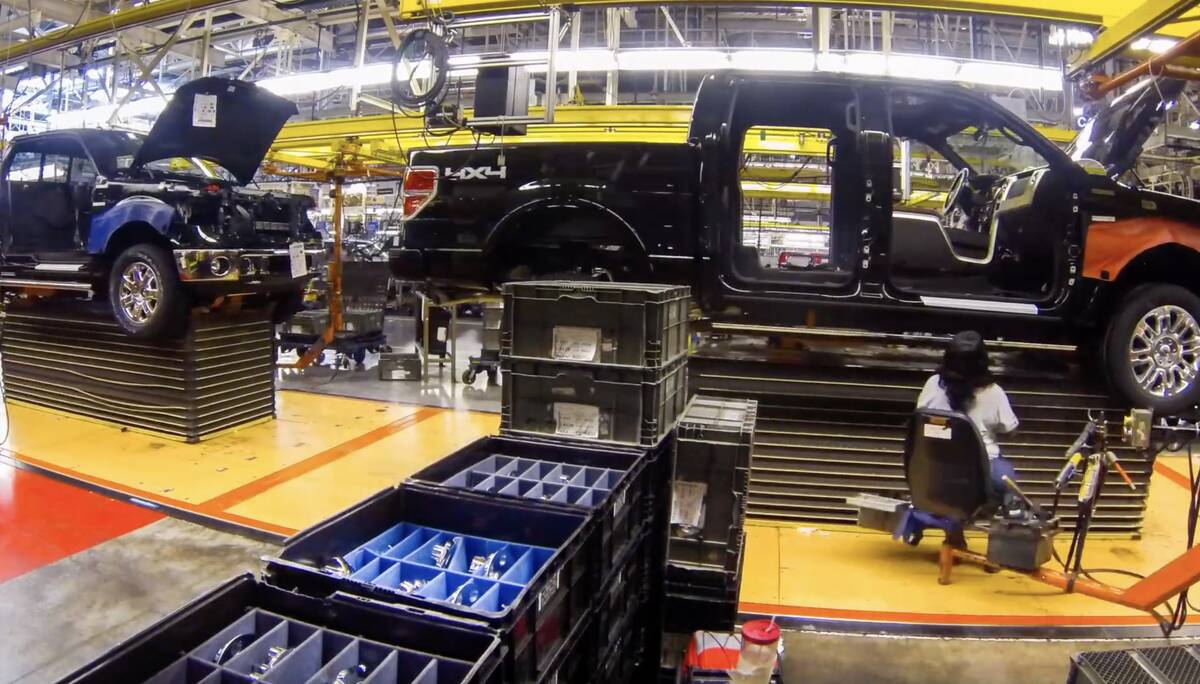
Is the technology in our vehicles a help or a hindrance?
Not only does new tech allow people to operate vehicles and farm machinery with fewer skills, it also creates more problems for vehicle users when those systems fail, Scott Garvey writes.
The market also frequently suffers with extremes in both pessimism and optimism. This is because the market exhibits the collective sentiment of all market participants, and most humans are prone to crowd behaviour. This groupthink tendency moves market participants in the same direction at the same time, creating panic pessimism or overt optimism.
Rather than rely on emotions, it is best to understand historical market behaviour. There are very few economic circumstances the market hasn’t seen, and as the saying goes, the four most dangerous words in market lexicon are “this time is different.” While there are no perfect predictors, past behaviour is a strong guidepost for the future.
Dividing 96 years of historic S&P 500 performance into four categories shows the following performance frequencies — down more than 12.5 per cent just seven of the years, down but less than 12.5 per cent 18 of the years, up from zero to 12.5 per cent 21 of the years and up more than 12.5 per cent an astounding 50 of the years. A complementary statistic is that it is up 25 per cent or more as frequently as it is down, one in four years.
Since 1969, there has been a drawdown of 10 per cent or more about every two years. When a drawdown like the recent 10 to 15 per cent occurs, there is an equal fifty-fifty probability it will recover quickly, or it will get worse. Of the times it gets worse, half will only become a 15 to 20 per cent drawdown and the other half will become a bear market defined as 20 per cent or greater. In short, half the years exhibit no significant pullback, 40 per cent have a 10 to 20 per cent correction and on seven occasions (and unlucky 13 per cent of years) there was a bear market. This adds up to slightly more than 100 per cent because some years exhibit two pullback events.
Understanding the frequency of events should provide the impetus to stay the course during a pullback event. They are normal market behaviour and true investors enjoy them because they provide the opportunity to buy cheaper. However, what occurred during the COVID crash two years ago was a little too much of a good thing.
The S&P 500 has averaged a 10.5 per cent annual return since 1926. The TSX has averaged a 9.6 per cent annual return for the past 50 years. While there are many naysayers, I believe these long-term historical averages are likely to continue.
Individual security or stock selections
When selecting stocks, it’s important to look at both company efficiency metrics (how well a company performs) and valuation metrics (how much you pay for it). Ideally, we want to buy a high-performance company at a low price.
Efficiency metrics include the common return on equity (ROE) and return on assets (ROA), which are ratios of earnings/equity and earnings/assets. Earnings are a somewhat flawed metric, can be manipulated by management and are calculated multiple ways.
There have been studies showing that cash flow is a better metric. I have always focused on cash flow because it is a simpler measure. I use the cash flow/equity (CF/E), cash flow/assets (CF/A) and free cash flow (cash flow minus capital expenditures) as my primary company efficiency metrics. I also look at historic growth rates, mainly 10-year growth in revenue and cash flow per share, and what is a bit of guesswork, ponder whether that growth rate is likely to continue. These ratios are easily calculated from any investment website or the company’s annual statements.
Valuation metrics include the common price-to-book (P/B), price-to-sales (P/S) and price-to-earnings (P/E) ratios. However, with my cash flow focus, I use price to cash flow (P/CF) and price to free cash flow (P/FCF) as my main criteria. Desiring high efficiency and growth metrics at a low price, I like companies with CF/A of over 10 per cent with a P/CF ratio under 10 that have doubled their revenue and cash flow over the past decade. I willingly pay a higher P/CF cost for higher CF/A efficiency and faster growth as long as CF/A is greater than P/CF.
Different industries have different comparative ratios, like health care and tech are normally more expensive than industrial companies. Cash flow is not a good measure for banks or lifecos so I revert to P/E and ROE.
I try to pick stocks I think will be in the portfolio a long time. As Warren Buffett says, “If you are not willing to own a stock for 10 years, don’t even think about owning it for 10 minutes.”