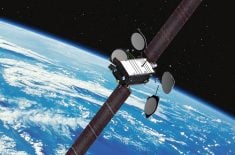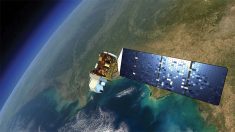

You can’t beat an eye in the sky when it comes to telling you what’s happening on the ground with your crop, says a longtime Iowa crop management specialist.
Different types of aerial imagery that show visual differences during the growing season can be an extremely valuable tool for pointing to shortfalls or successes concerning everything from nutrient management, to misapplications with equipment, to weed and pest control problems, says Pat Reeg, operations manager with the On-Farm Network of the Iowa Soybean Association.
Reeg, who recently gave a presentation to a Tactical Farming Conference in Calgary says aerial imagery taken from a plane, helicopter or newer technology such as drones can tell a very clear and visual story about treatments that work or don’t work, or simply just raise a flag about some difference in the crop that needs to be checked out on the ground.
Read Also
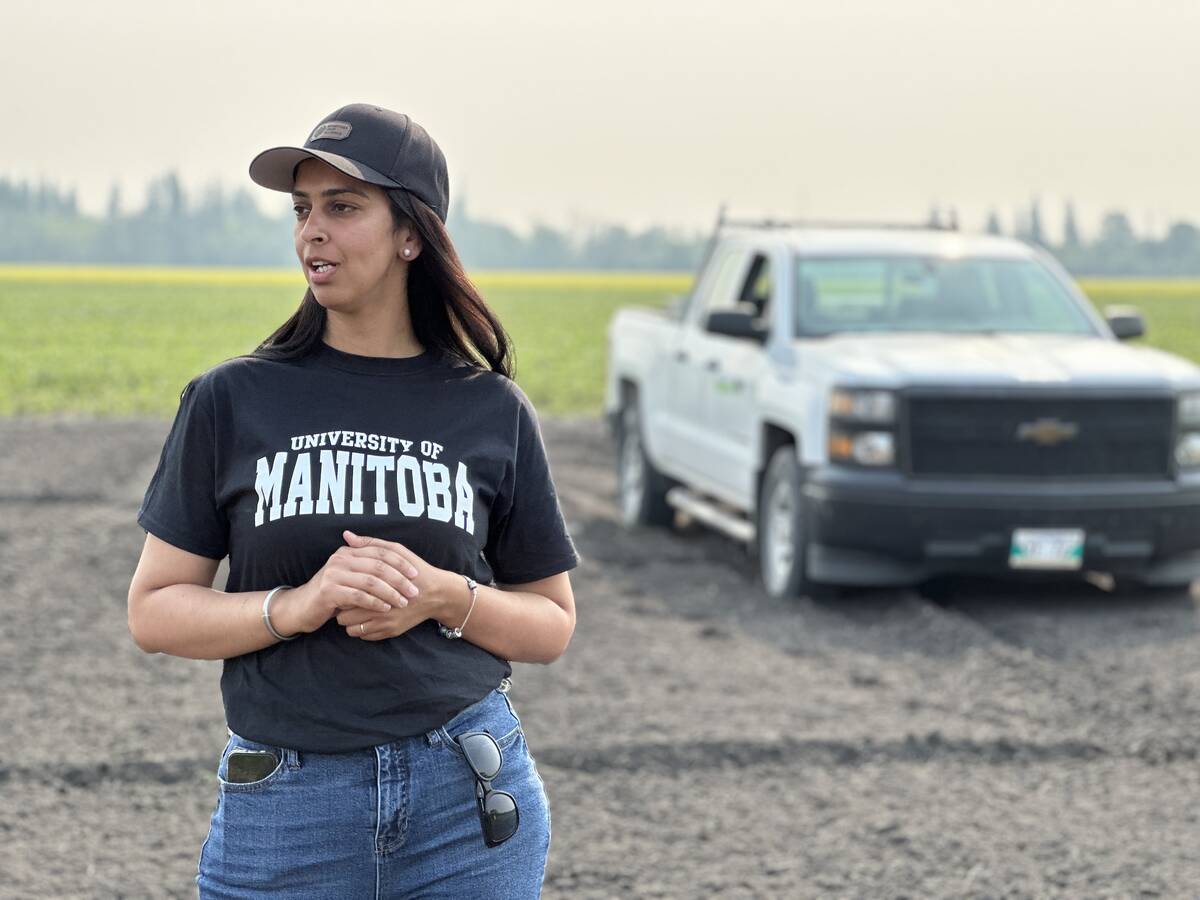
Corn research looks for Manitoba-based weed control
Manitoba corn growers rely on U.S. or Ontario weed control recommendations. University of Manitoba researchers are developing weed control advice with Manitoba field conditions in mind.
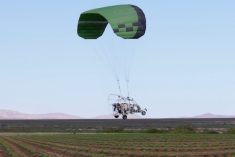
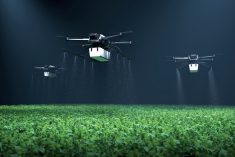
The Iowa association, which conducts a wide range of on-farm, field-scale research projects every year, relies on aerial imagery to provide a report card on different treatments applied in test strips as well as to show what is happening across a field — and actually the whole state, says Reeg. It is not necessarily brand new technology — some of it was developed by Kodak during WWII — but it isn’t likely technology that most individual farmers would own themselves. They are tools that can be used by an applied research association, or a crop consulting service as crops and field trails are evaluated during the growing season. In this new era of drones (also described as UAV’s — unmanned aerial vehicles) he says they can be useful in capturing images over a field or even a single farm, but for large areas, images collected from a manned aircraft is far more efficient.
Reeg says the most common imagery tools for evaluating crops include:
- An RGB image which shows natural red, green and blue band colours — it is useful for identifying chlorophyll and plant pigment colours — i.e. those are weeds, that’s the crop, or this is where fertilizer worked or it didn’t; another is NIR (near infrared) images, which shows changes that aren’t visible by the naked eye but will show differences in plant cell structure;
- There is also LiDAR (light detection and ranging) images which can identify variations in plant height; thermal imagery can be used to look at differences in plant temperature and water transpiration;
- Colour infrared imagery, a combination of NIR and red and green is used to quantify biomass variation and plant health characteristics in a field;
- And of course NDVI (normalized difference vegetation index) image or vegetation image which shows the density of green on an area of land.
To collect most of these images, the Soybean Association uses what’s known as a four-band (or four sensor) camera, which can produce an RGB (red, green, blue) image, a near infrared image, an NDVI image, and then by overlapping these bands other types of images as well.

“From these various forms of imagery you can tell a great deal about what is happening in a crop,” says Reeg. “If you are looking at on-farm test strips, you know where you applied treatments — is there a difference between that and untreated area? The imagery can show variations over a field, which relate to areas of different soil type, different nutrient levels or both. It is easy to identify areas of proper or misapplication of crop inputs,” and the list goes on. Another key piece of information is to know when the photo or image was taken — what point of the growing season.
He says aerial imagery is a valuable tool in reading one of the most important sensors on the farm — the plants themselves. “One of the most complex and best sensors we can utilize are the growing plant sensors in our fields,” he says. “A typical 80-acre field of soybeans has 12 million plant sensors. The potential to remote sense these plants and identify problems before visible to the human eye is just one of the many opportunities that remote sensing can potentially offer.”
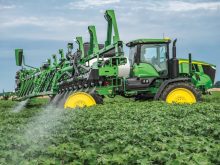
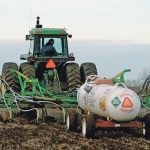
In his presentation he showed an image of a field that have received liquid manure application. Some parts of the field had an obvious different pattern of colours indicating the application had been quite uneven. In another NDVI image, showing field scale test trips, the headlands of the test strip showed up as red compared to the rest of the field, which was mostly green with patches of yellow. The red was an indicator of problem areas — different vegetation or flooded parts of the field. The green was good healthy crop, while yellow indicated crop that had been damaged. Another image showed a soybean field had been treated with a fungicide and a large area on the perimeter of the field showed up as grey, indicating an area where disease pressure had been so great the treatment was ineffective. And still another image showed a field after it had been treated with a crop protection product applied by an aerial applicator. That imagine showed the target area for treatment, but also the unintended areas affected by spray drift.
Reeg says the remote sensing tools might be an indicator of whether a treatment worked or didn’t work, or it may just point to an area of the field where something is different.
“So it may just tell you that you need to be out on the ground and it shows you where you need have a look,” he says. “To properly evaluate imagery you need to know your fields, need to know your soils, need to know cropping history, fertilizer history, and other treatment history — knowing your land, knowing the cropping history, combined with the aerial imagery can give you a pretty good idea of what is going on.”

He says it is also of value to access or develop a library or find a history of aerial imagery. In Iowa for example they are fortunate to have some imagery dating back more than 80 years and a series of aerial imaginary covering most decades until the present time. That history of air photos not only will identify chronic productivity issues of a field, but also shows where changes or improvements have been made.
And historical aerial photography can also just be interesting. Reeg says for example he can look at an aerial photo of his own family farm taken in the 1930s and what appears to be a hatch pattern in a field is really stooks of wheat waiting to be picked up and taken to a threshing machine.
Reeg says aerial imagery, both in high and low resolution, is an important compliment to really understanding other data collected on the farm such as yield monitor information. The area or spatial resolution of images, referred to as pixel size, can range from one centimetre pixels to more than 30 meters depending on the digital camera and end-use needs.
“A yield monitor and GPS can provide spatial information on final yield, but additional information is needed to explain the yield variability,” says Reeg. “As harvest equipment continues to increase in size for row crops such as soybeans and corn, for example, so does the spatial resolution of the yield data making it difficult to detect row to row variability. Remote sensing can fill in the gaps that yield mapping is unable to provide. These precision agriculture technologies complement each other providing farmers and advisors data for informed decisions and improved crop management.”
For more information on field trials and aerial imagery check out on-line reference sources such as the Guide to On-Farm Replicated Strip Trials, check out the Iowa Soybean Association On-Farm network at isafarmnet.com.