Statistics Canada’s latest seeded acreage report shows a record canola area that comes as no surprise to most market participants as it fell within their expectations.
"I don’t think it was a surprise that canola acres really slipped across 21 million acres," said Ron Frost, a veteran analyst with Frost Forecast Consulting in Calgary. "The trade had an average guess of moving up by half a million acres, and it was maybe 700,000 or 800,000 acres higher."
The StatsCan report released Wednesday shows figures as of June 7. Seeded canola area was pegged at 21.27 million acres, compared to 20.37 million acres estimated in the federal agency’s March report, and 18.86 million acres in 2011.
Read Also

Wheat breeding system no longer works, Canadian Wheat Research Coalition report says
A Canadian Wheat Research Coalition report, published Feb. 26, says the status quo is not an option for Canada’s wheat breeding system. It must be transformed, by farmers.
Jerry Klassen, manager of GAP Grains and Produits Canada in Winnipeg, said more canola acres were seeded this year because prices are strong for producers, and wet conditions across the Prairies made it easier to seed.
Though acreage numbers were higher, the report is not expected to move the canola market at all because the trade was expecting the numbers to increase.
"There are so many other things that are overshadowing it (the report) now," said Ken Ball, a trader with Union Securities in Winnipeg. "The acres are no longer the issue; it’s just weather on both sides of the border."
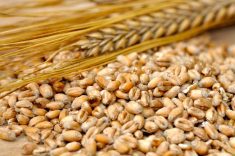
Total wheat acres were down from the March 2012 report, and hit the low end of market expectations, which surprised some participants.
"I think people were anticipating that we would see more wheat, so that could be a bit supportive for the Minneapolis wheat market," Klassen said.
However, others said they weren’t caught off guard by the lower wheat acreage number.
"I had thought wheat acreage might drop even slightly more than it ended up," Frost said. "The return for wheat just didn’t really stack up that great during the April, early May time period."
The June 27 number for all wheat was 23.81 million acres, down from 24.33 million acres in March and 21.46 million acres in 2011.
"Underestimated"
Oats fell below trade expectations, at 3.07 million acres, which compares to expectations of 3.1 million to 3.5 million acres, and the March report number of 3.39 million acres.
Mike Jubinville, an analyst with ProFarmer Canada in Winnipeg, said oat acreage was lower because the return isn’t as good for producers as it is for other crops.
Participants were surprised, however, by the summerfallow acreage numbers from the June 27 StatsCan report.
"I think the unseeded acreage could be underestimated by about a million acres, so there will be a little bit of change in subsequent reports," Frost said.
The June report put summerfallow acreage at 3.86 million acres, down from 3.97 million acres in the March 2011 report, and 12.41 million acres in 2011.
The lentil acreage number was also higher than what the trade was expecting and hoping for, an industry official said.
"There was certainly some talk that in between the March report and this one that we could’ve had that acreage number actually drop," Frost said.
Frost said because the number was higher, there were concerns that there could be an excess supply of lentils. However, those worries are being offset by excessive wetness in lentil-growing regions that is causing the crops to look yellow.
Lentil acreage was pegged at 2.61 million acres in Wednesday’s report, which compares to 2.46 million acres in March and 2.57 million acres in 2011.
– Terryn Shiells writes for Commodity News Service Canada, a Winnipeg company specializing in grain and commodity market reporting.
Table: A recap of Statistics Canada’s seeding estimates report for the period ended June 7. Pre-report expectations are provided for comparison. Figures are in millions of acres.
| StatsCan | Pre-report | StatsCan | Actual | |
| June 2012 | estimates | March 2012 | acres, 2011 | |
| Canola | 21.273 | 20.400-22.000 | 20.372 | 18.862 |
| All wheat | 23.812 | 23.400-24.700 | 24.325 | 21.464 |
| Durum | 4.710 | 4.900-5.100 | 5.100 | 4.015 |
| Barley | 7.365 | 7.710-8.300 | 7.968 | 6.472 |
| Flaxseed | 1.070 | 0.900-1.000 | 1.090 | 0.695 |
| Oats | 3.074 | 3.100-3.500 | 3.393 | 3.109 |
| Peas | 3.495 | 3.300-3.370 | 3.310 | 2.328 |